May 10, 2026
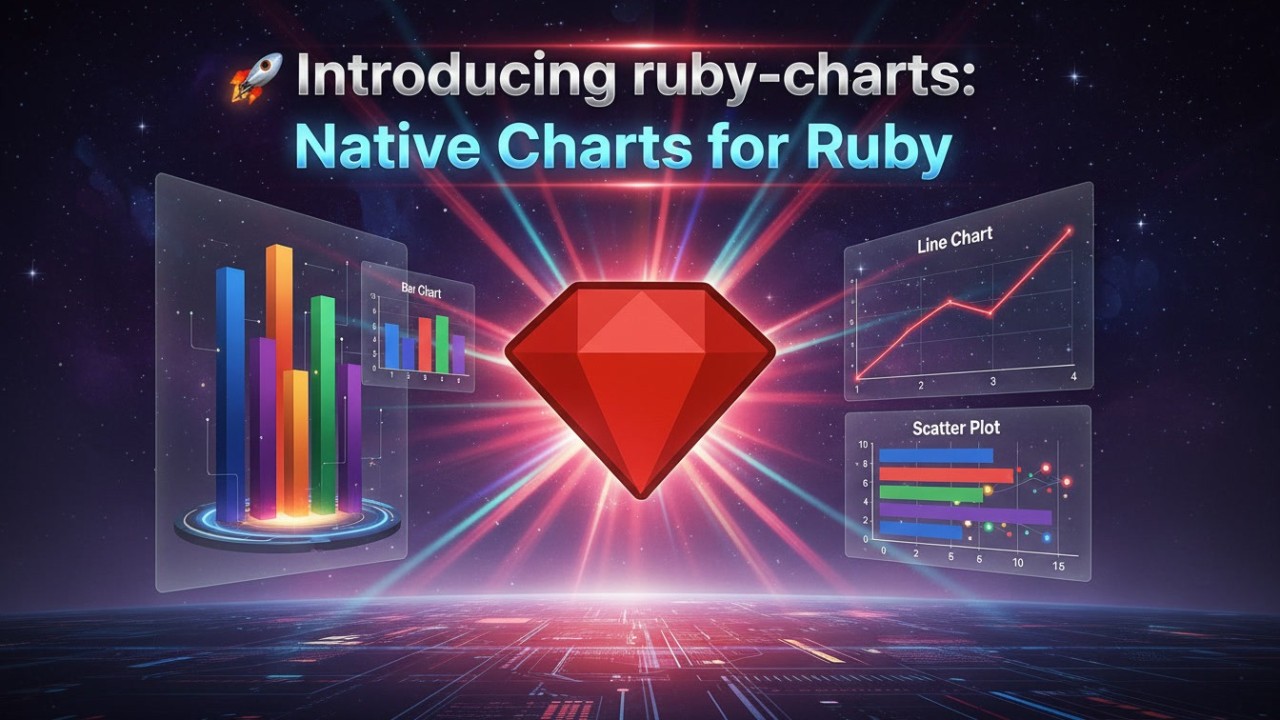
Last Friday I released ruby-charts, a gem for generating charts directly in Ruby—no JavaScript, no external APIs.
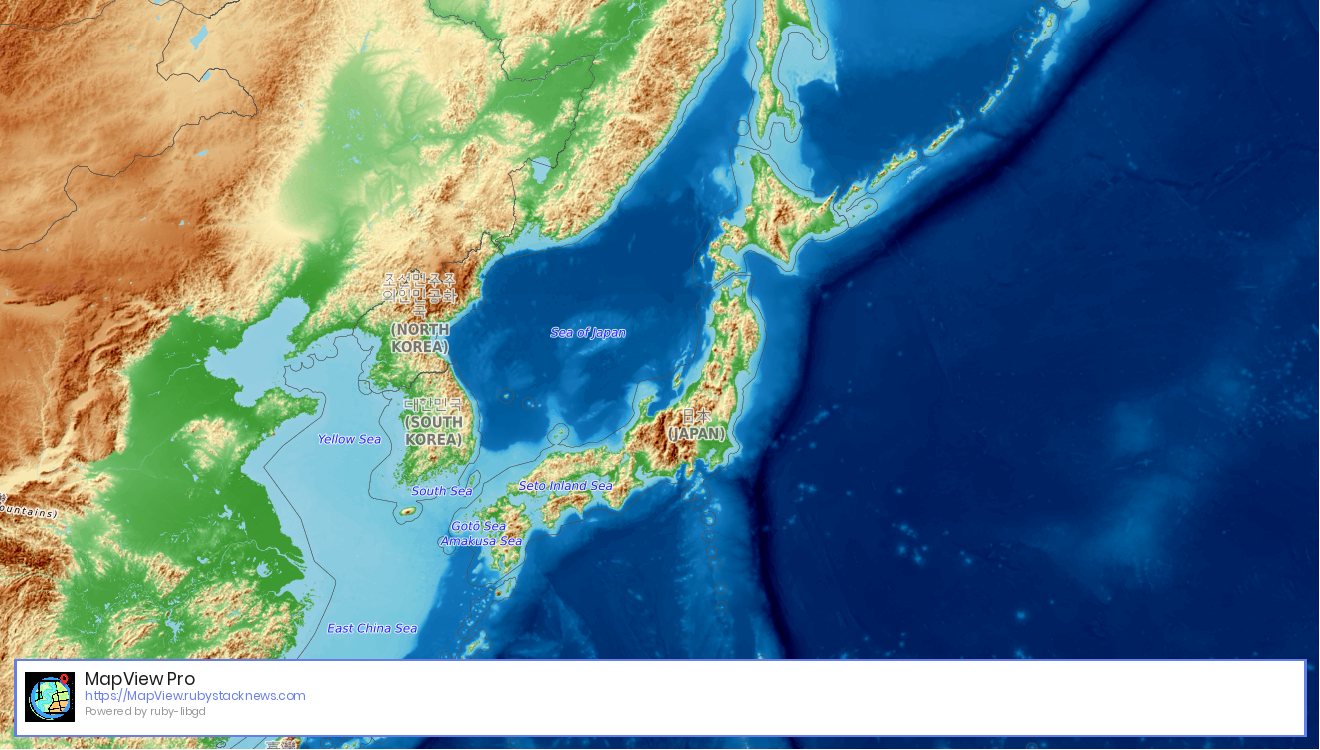
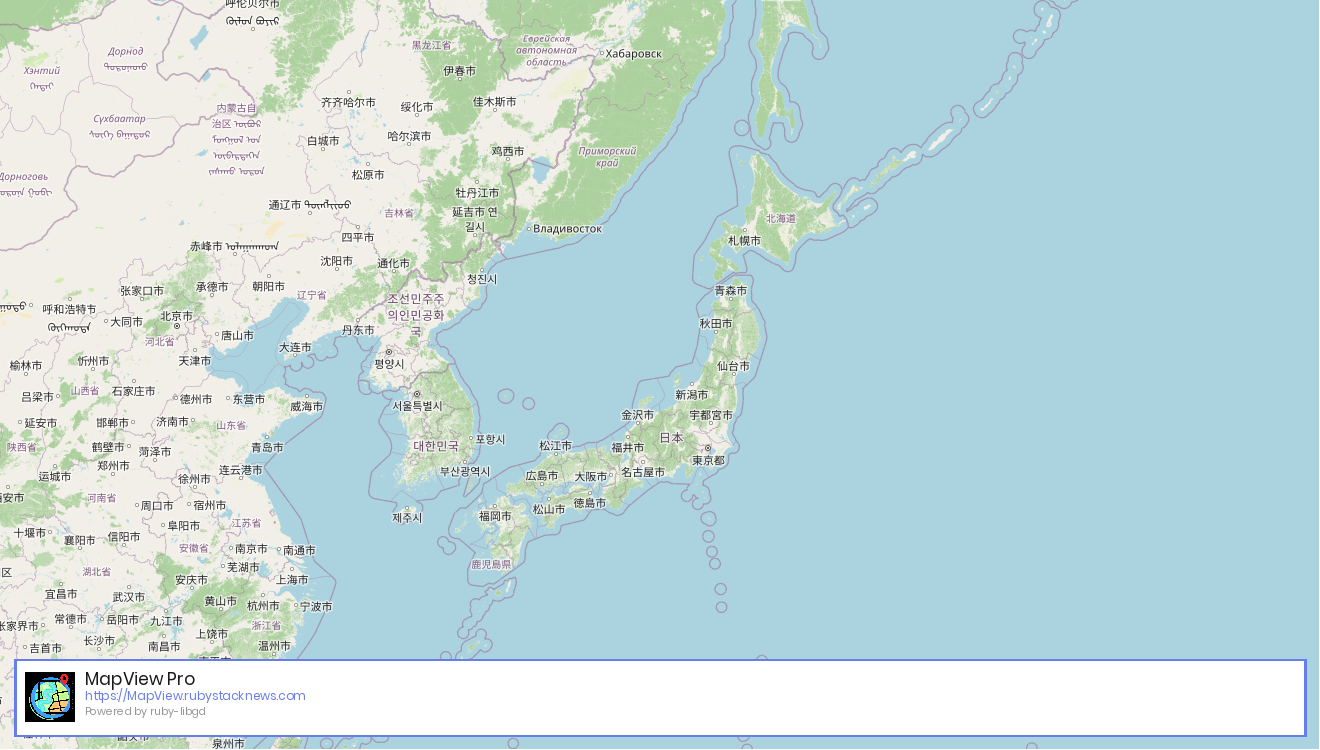
It started while building MapView (geospatial rendering). I needed server-side charts and realized there wasn’t a clean, native solution in the Ruby ecosystem.
What it does:
- Generate charts from CSV, XLSX, YAML, or Ruby data
- Output PNG/JPEG/GIF/WebP
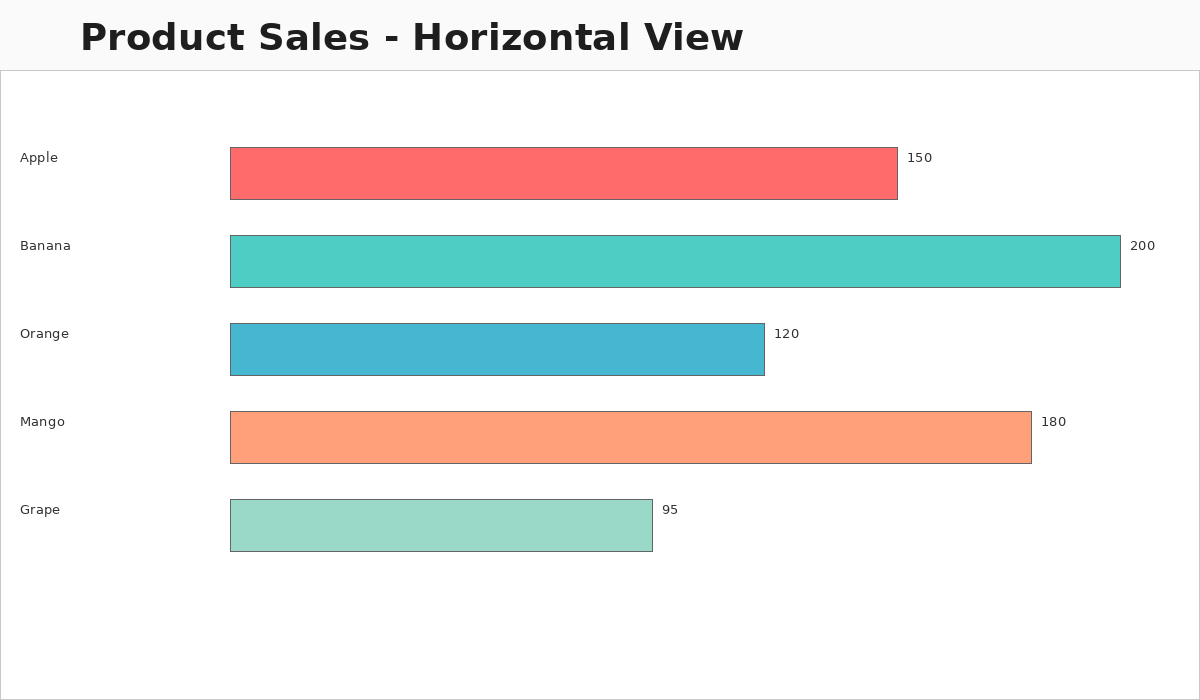
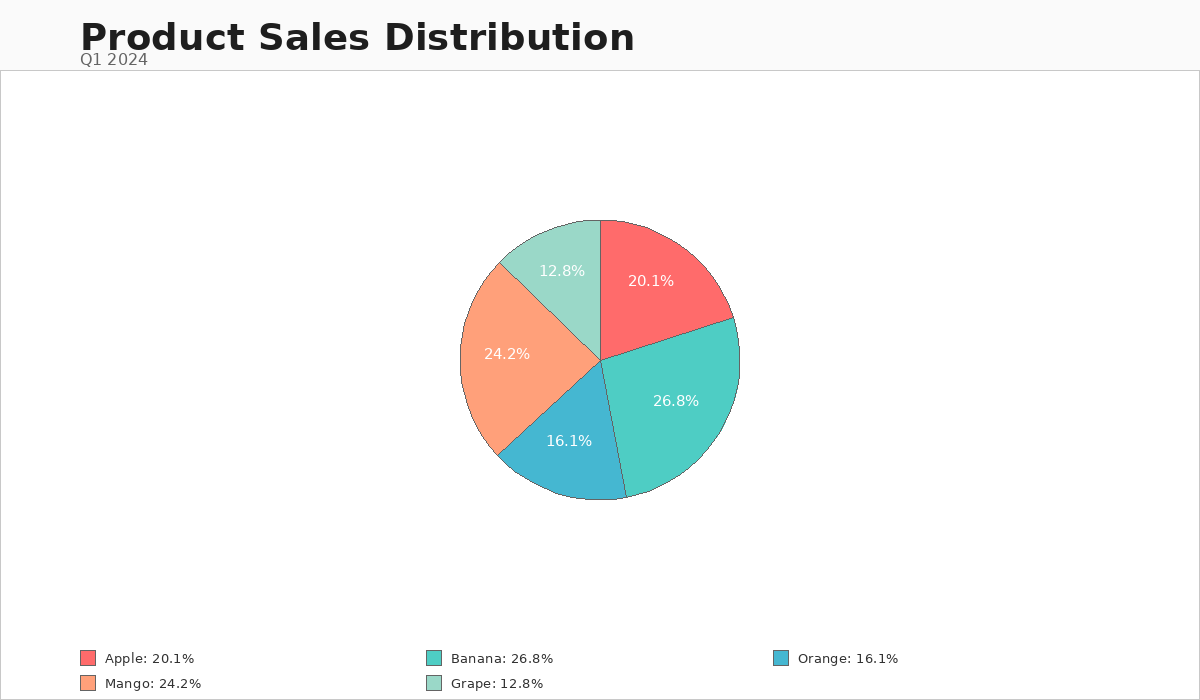
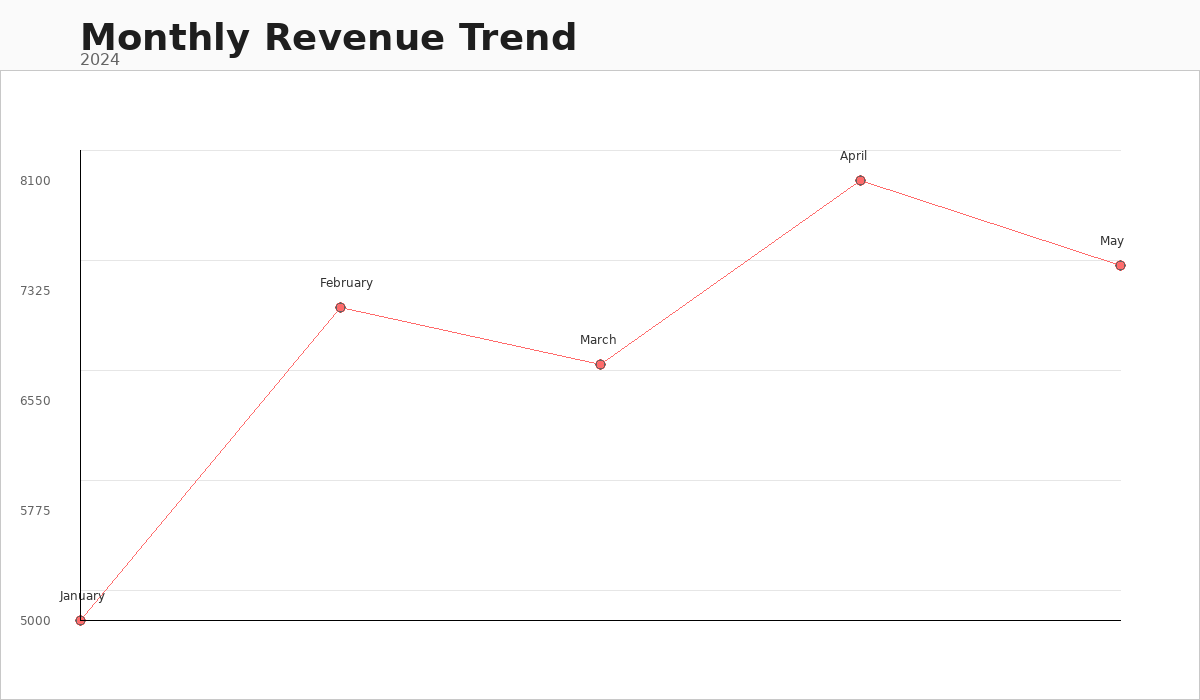
- Supports pie, bar, and line charts
- Fully server-side (works great in jobs, reports, emails)
RubyCharts.from_csv('sales.csv') .type(:pie) .title('Q1 Sales') .save('report.png')
Under the hood, it builds on ruby-libgd (C bindings to libgd), so the focus is on performance + minimal dependencies, while keeping an idiomatic Ruby API.
This is part of a broader ecosystem:
- ruby-libgd → low-level graphics
- libgd-gis → geospatial rendering
- ruby-charts → data visualization
Looking for feedback
The gem is in alpha, but already usable. I’m especially interested in:
- Missing chart types
- API design feedback
- Real-world use cases (Rails apps, reporting, etc.)
Try it:
- RubyGems: https://rubygems.org/gems/ruby-charts
- GitHub: https://github.com/ggerman/ruby-charts
What would you build with native chart rendering in Ruby?