May 7, 2026
Modern chart rendering usually assumes a browser, a JavaScript runtime, or a frontend stack.
But many Ruby applications do not actually need interactive dashboards.
They need deterministic image generation.
Things like:
- scheduled reports
- PDF exports
- transactional emails
- admin dashboards
- analytics snapshots
- CI metrics
- server-side rendering pipelines
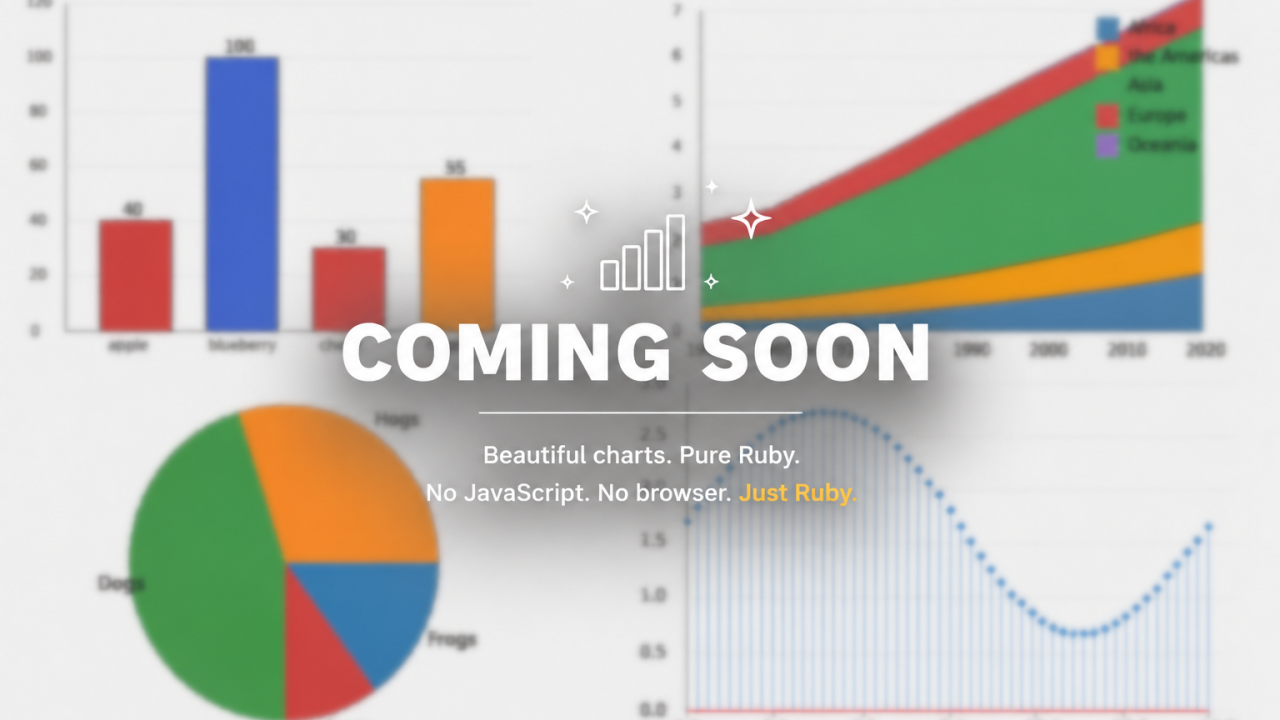
That was the motivation behind building RubyCharts: a lightweight chart rendering library written for backend-oriented Ruby workflows.
The project is still under active development, but the core idea is already working: generate PNG charts directly from Ruby using native rendering primitives.
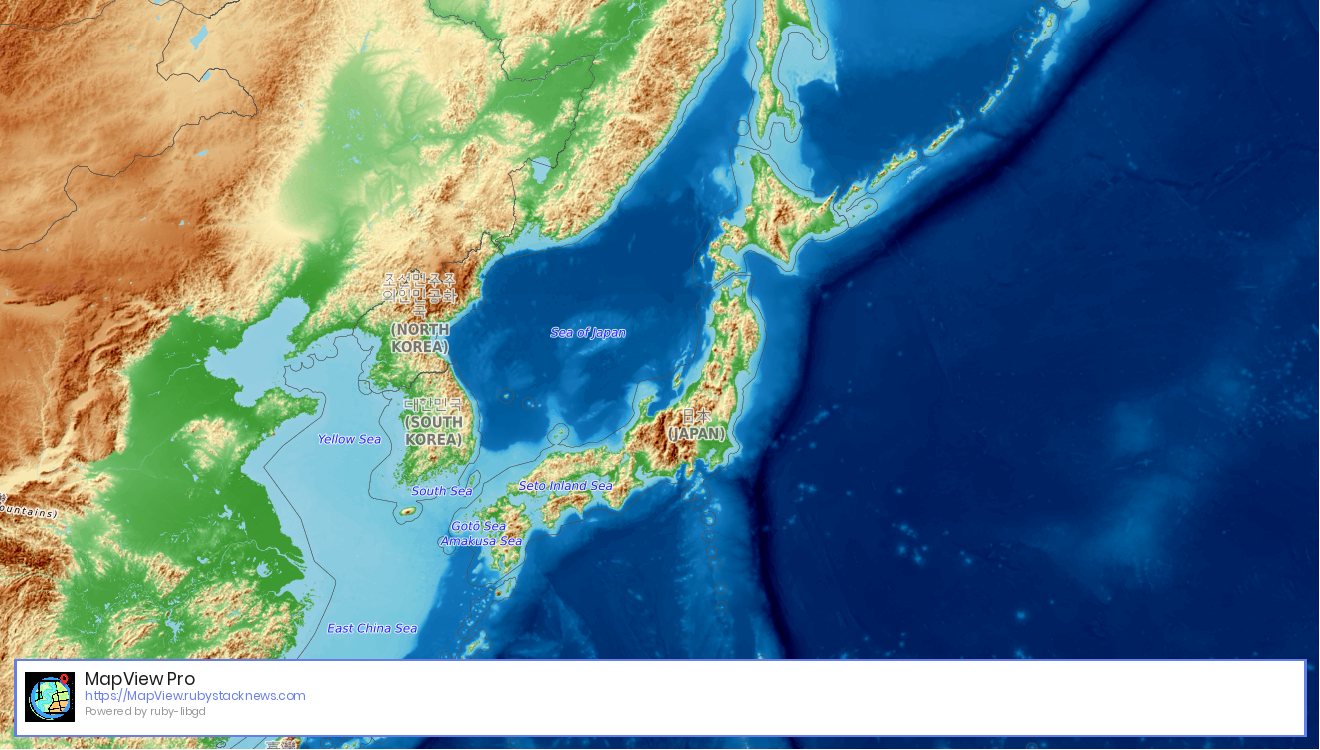
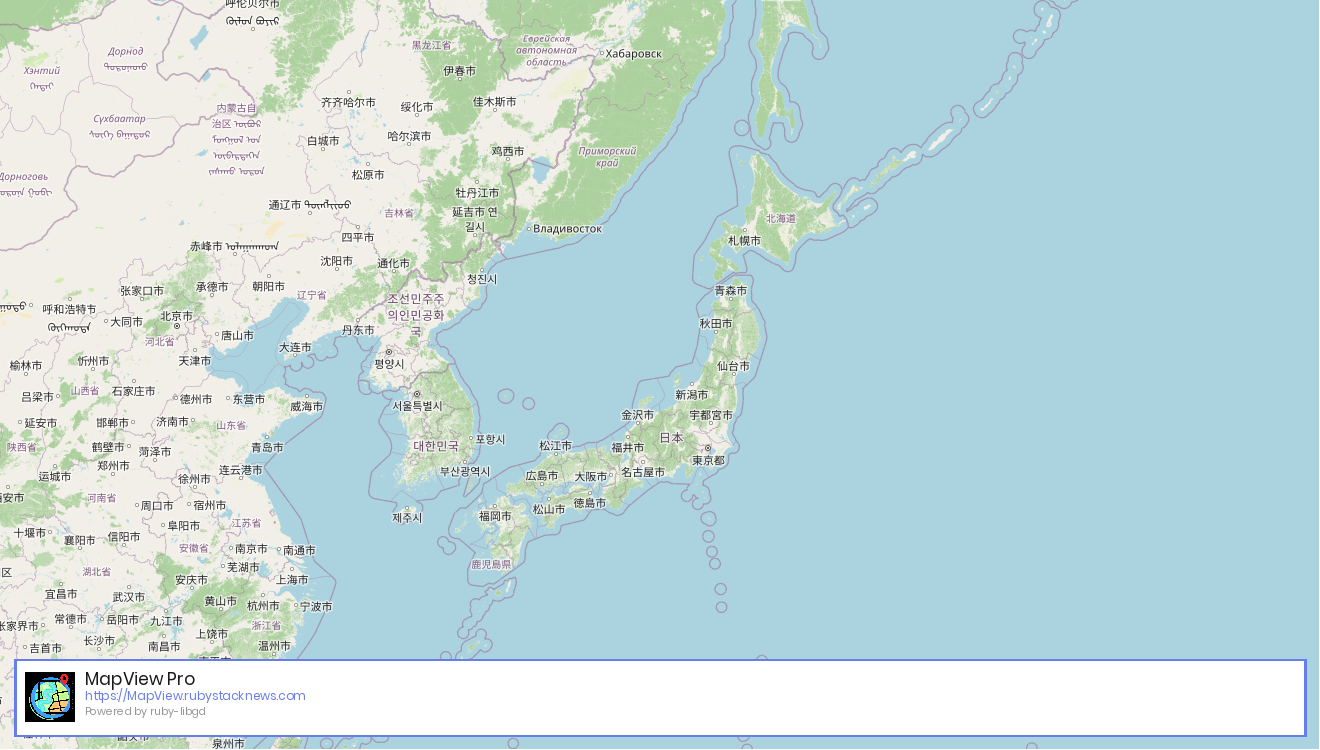
The rendering backend is powered by ruby-libgd.
The Goal
The goal was not to create another browser-based visualization framework.
The goal was:
- no JavaScript runtime
- no headless browser
- no external rendering service
- no ImageMagick shelling
- simple Ruby API
- static image generation
- lightweight server-side rendering
The current API is intentionally small:
RubyCharts.from_csv('sales.csv') .type(:pie) .title('Product Sales Distribution') .subtitle('Q1 2024') .save_png('output/chart.png')
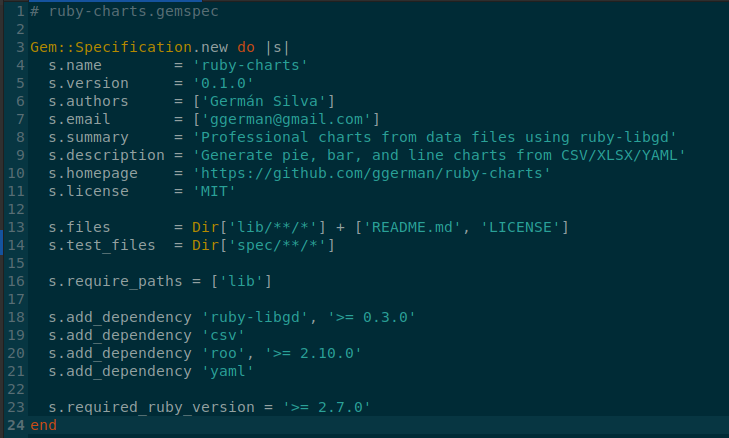
Data can currently be loaded from:
- CSV
- YAML
- Ruby hashes
- XLSX
Supported chart types include:
- pie charts
- vertical bar charts
- horizontal bar charts
- line charts
Why Native Rendering?
One of the most interesting parts of this project is the rendering layer itself.
Instead of delegating image generation to external tools, the charts are rendered directly through GD using a Ruby C extension.
That means the rendering pipeline stays fully inside the Ruby process.
The underlying graphics layer comes from:
This enables direct access to:
- PNG encoding
- JPEG encoding
- WebP encoding
- drawing primitives
- alpha blending
- in-memory image generation
For example:
static VALUE gd_image_to_png(VALUE self) { gd_image_wrapper *wrap; TypedData_Get_Struct(self, gd_image_wrapper, &gd_image_type, wrap); int size = 0; void *data = gdImagePngPtr(wrap->img, &size); VALUE str = rb_str_new((const char*)data, size); gdFree(data); return str;}
That small method opens interesting integration possibilities for Ruby applications.
Instead of writing files to disk, charts can be streamed directly from memory.
Example:
send_data chart.to_png, type: 'image/png'
That becomes useful for:
- Rails controllers
- APIs
- background jobs
- email attachments
- ActiveStorage uploads
- PDF generation
The Rendering Pipeline
Internally, the library is organized around a small rendering pipeline:
Loader → Builder DSL → Chart Renderer → GD Backend → PNG/JPEG/WebP
The current architecture separates:
- data ingestion
- chart configuration
- chart rendering
- image encoding
The public API intentionally hides the lower-level drawing primitives.
Users interact with charts at a higher abstraction level:
RubyCharts.from_yaml('data.yml') .type(:line) .title('Monthly Revenue') .save_png('line_chart.png')
While internally, the library handles:
- scaling
- coordinate calculations
- text rendering
- color allocation
- image composition
- output encoding
Why This Matters for Ruby
Ruby has excellent tooling for:
- web applications
- APIs
- background jobs
- automation
But lightweight native graphics tooling is still relatively uncommon in the ecosystem.
Many existing chart solutions depend on:
- browser runtimes
- Node.js
- JavaScript wrappers
- external chart services
RubyCharts explores a different direction: backend-native rendering infrastructure.
That is particularly useful for:
- reporting systems
- offline environments
- automated exports
- low-resource deployments
- deterministic rendering workflows
Current Status
The project is still early.
Some planned areas include:
- SVG backend support
- theme systems
- better layout engines
- legend improvements
- font management
- scaling abstractions
- additional chart types
But the core rendering pipeline is already producing usable charts.
Coming Soon
RubyCharts is currently being prepared for a public release.
The graphics backend powering the renderer is already available here:
If you are interested in:
- Ruby native extensions
- server-side graphics
- backend rendering pipelines
- lightweight infrastructure tooling
this project will probably be worth following over the next few weeks.