March 31, 2026
The Love Affair

🚀 See the LIVE DEMO in action
MapView
Render maps directly from your backend no external APIs required. Fast, controlled, and production-ready.
Try the demo →You know the feeling. Local machine, Rails server running, something breaks. You glance at the terminal and there it is: a beautiful stack trace with every detail you need.
Started GET "/articles/999" for 127.0.0.1 at 2026-03-31 10:23:45 -0300Processing by ArticlesController#show as HTML Article Load (0.8ms) SELECT * FROM articles WHERE id = 999 LIMIT 1Completed 404 Not Found in 15msActiveRecord::RecordNotFound (Couldn't find Article with 'id'=999):app/controllers/articles_controller.rb:7:in `show'
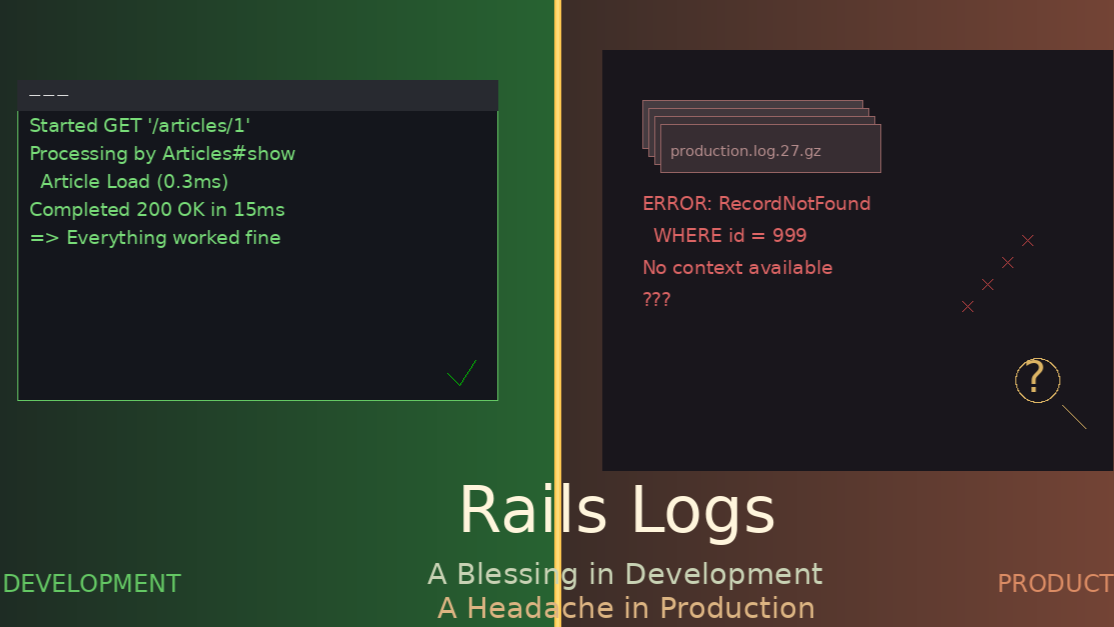
HTTP method, path, controller, action, SQL query, error, line of code. Everything. In development, logs are a blessing.
Then you need to find what happened in production three weeks ago. That’s when the blessing becomes a curse.
The Descent
It’s Monday 10 AM. Your manager says: “A user reported an error from last month. Can you see what happened?”
What you have:
- 30 compressed log files
- 100 MB each
- Thousands of requests mixed together
- No request_id, no user, no exact time
Your tool is zgrep.
zgrep "RecordNotFound" production.log.*.gz | grep "articles"
500 lines come back. Different days. Different users. No context. No way to know what came before or after.
Logs stop being a luxury. They become a headache.
Why This Happens
We assume logs work the same everywhere. They don’t.
In development:
- One process, one request at a time
- Logs in your terminal, live
- Context is what’s on screen
- Time is now
In production:
- Hundreds of processes, thousands of requests per minute
- Logs in cold, compressed files
- Context scattered across thousands of lines
- Time could be any moment in the last 30 days
Reading a novel versus finding a sentence in a 30,000-book library without an index.
Structured Logging
Plain text is beautiful to read:
Started GET "/articles/1" for 127.0.0.1
But it’s useless for searching. JSON logs give you something different:
{ "method": "GET", "path": "/articles/1", "ip": "127.0.0.1", "request_id": "abc-123-def", "user_id": 42, "status": 200, "duration": 15}
Now you can search with grep ‘”user_id”:42’ and get every request from that user. Each line tells its own story.
# config/environments/production.rbconfig.lograge.enabled = trueconfig.lograge.formatter = Lograge::Formatters::Json.new
One change transforms how you search.
Request ID: The Thread
Rails 7+ includes ActionDispatch::RequestId by default. Every request gets a unique ID that appears in every log line from that request.
In development you don’t notice. In production it’s your lifeline:
grep "abc-123-def" production.log
You get everything: SQL queries, error, rendering time, completion status. The development stack trace, in production.
With JSON logs you can search without remembering the ID:
grep '"user_id":42' production.log | grep '"status":500'
After a Month
Searching for an incident from 28 days ago. Logs rotate daily. You have 30 compressed files.
# Search all compressed fileszgrep "some_error" production.log.*.gz# Narrow by datezgrep "some_error" production.log.2*.gz | grep "2026-03-01"# Find surrounding contextzgrep -A 5 -B 5 "some_error" production.log.2026-03-01.gz
Digital archaeology. Piecing together a story from fragments. Hoping you have all the pieces.
Without structured logging, you can’t even search by user_id. You search by error message fragments, hoping the wording didn’t change between Rails versions.
Tools That Help
lnav – Terminal log viewer that understands timestamps. Navigate by time, filter, see context across files.
lnav /var/log/myapp/
Loki + Grafana – Open source stack. Loki indexes logs by labels, Grafana gives you a web interface.
docker-compose up loki promtail grafana
Search like Google: “show me all 500 errors from last week for user_id 123”. It appears.
If you have budget, Datadog or New Relic do this with less setup.
Honeycomb – Next level. Instead of searching logs, you query traces. “Show me all requests that took more than 5 seconds from Brazil that called the payment service.” That’s not log search anymore. That’s a query.
Strategies That Work
Log rotation with purpose
config.logger = ActiveSupport::Logger.new( config.paths['log'].first, 30, # keep 30 files 100.megabytes # 100 MB each)
# /etc/logrotate.d/myapp/var/log/myapp/*.log { daily rotate 30 compress delaycompress}
Rich context on every line
config.lograge.custom_options = ->(event) do { request_id: event.payload[:request_id], user_id: event.payload[:user_id] || "guest", ip: event.payload[:ip], controller: event.payload[:controller], action: event.payload[:action] }end
Aliases that save time
alias prod-errors='zgrep "ERROR\|WARN" /var/log/myapp/production.log* | tail -50'alias prod-user='function _(){ zgrep "\"user_id\":$1" /var/log/myapp/production.log* }; _'alias prod-request='function _(){ zgrep "$1" /var/log/myapp/production.log* }; _'
Simulate production in development
config.log_tags = [ :request_id, :subdomain ]config.log_level = :infoconfig.lograge.enabled = true
Use tail -f log/development.log | grep “something” while you work. Get comfortable with the format you’ll face in production.
The Cost
Every minute hunting through compressed logs is a minute not building features. Every hour piecing together what happened is an hour your users experience bugs you can’t diagnose.
But there’s another cost. When you can’t quickly answer “what happened to this user last month?”, trust erodes. Users lose trust. Your manager loses trust. You start doubting your ability to operate the system.
Logs shouldn’t be a source of anxiety.
What Works
After years of dealing with this, here’s what actually works:
JSON logs are non-negotiable. Plain text belongs in development. Production needs structure.
Request ID is your thread through the maze. Always have it, always log it.
Aggregation becomes necessary when you have more than one server or more than a week of retention. Don’t wait until you’re already suffering.
The right tool for the job:
- One server, low traffic: zgrep with JSON logs can work
- Few servers, moderate traffic: lnav or similar
- Multiple servers, any traffic: Loki, Datadog, or Honeycomb
Test your recovery. Once a month, try to find a specific user’s request from 30 days ago. If it takes more than five minutes, your system needs work.
Wrapping Up
Logs don’t have to be a headache. The problem isn’t logs themselves. It’s how we manage them.
In development, logs are a close companion. In production, they should be a searchable database, not a pile of compressed text files.
Structure them with JSON so each line stands alone. Tag them with request_id and context so you can trace requests. Aggregate them with tools designed for searching. Practice with those tools before you need them in an emergency.
The day you stop using zgrep and start querying, you’ll wonder why you suffered for so long. The log that saves you in development can be the same one that saves you in production. You just need to treat it right.
What about you? Still grepping through compressed files?