Static and animated cartography built directly from GeoJSON
For a long time, generating maps from code meant working inside heavy ecosystems designed primarily for analysis. Those tools are powerful, but they are not always the right fit. In many practical scenarios, the problem is simpler and more concrete: draw maps, show routes, place points, label them correctly, and have full control over how the final image looks.
Today, this kind of work can be done directly with Ruby.
Using libgd-gis, Ruby applications can generate static and animated maps from GeoJSON data, producing image outputs in PNG, JPG, WebP, and GIF, including animated GIFs for sequences and time-based visualizations. The focus is not on abstraction layers, but on building maps as visual artifacts: deterministic, reproducible, and fully controlled from code.
A practical approach to cartography
The workflow is intentionally straightforward:
- Start from GeoJSON data.
- Define visual styles declaratively using YAML.
- Render a final image using Ruby.
Data, styles, and rendering logic remain clearly separated. Styles describe how things should look; Ruby orchestrates the rendering process and produces the final image. The result is a clean pipeline that fits naturally into documentation workflows, reporting systems, batch processing, or automated exports.
This approach scales well from simple maps to more detailed compositions without introducing unnecessary complexity.
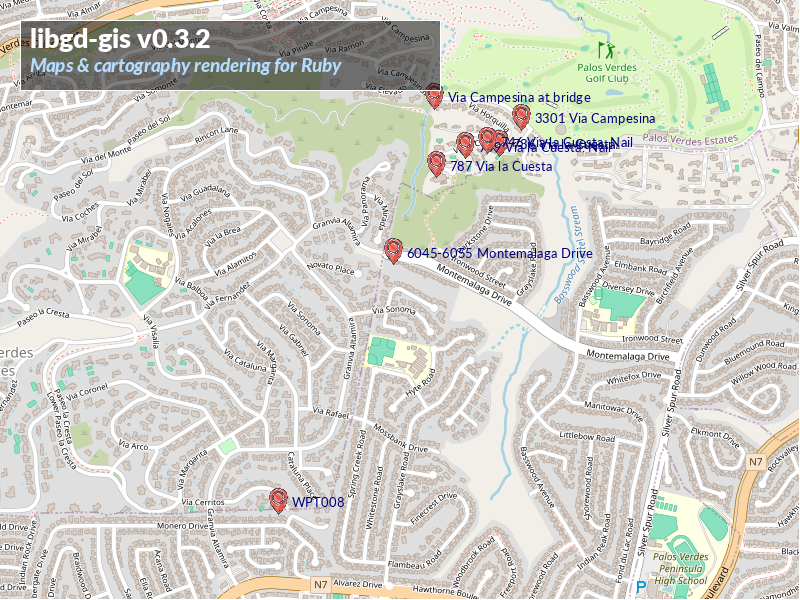
Points: precise control over markers and labels
The Points example shows how point-based data can be rendered with a high level of visual control.
From the same GeoJSON source, points can be displayed as:
- image icons
- numeric markers
- alphabetic markers
All visual aspects are defined in a YAML stylesheet:
points: color: [0, 0, 127, 0] font_color: [250, 250, 250] font: /usr/share/fonts/truetype/lato/Lato-Regular.ttf size: 10 icon: icon.pngThe Ruby script itself stays minimal. It loads the data, applies the style, computes the visible area automatically from the GeoJSON, and renders the final image.
This makes the example fully functional out of the box: change the data, adjust the style, rerun the script, and a new map is generated with consistent results. It is a practical solution for points of interest, waypoints, inventories, or any dataset where visual clarity matters.
MultiLineString: routes and paths rendered with intent
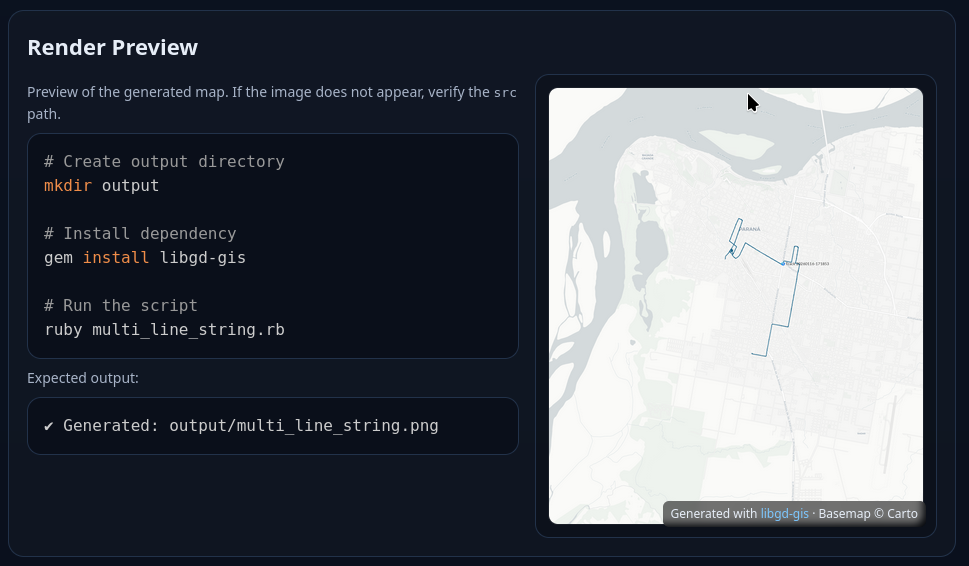
The MultiLineString example focuses on routes and paths.
Here, the emphasis is on how lines are drawn:
- stroke color
- stroke width
- layer ordering
- contrast against the basemap
Again, the styling lives entirely in YAML:
track: track: stroke: [0, 85, 127, 250] stroke_width: 3The Ruby code remains unchanged when experimenting with visual variations. This separation allows fast iteration on map appearance without touching rendering logic, making it easy to adapt the same data to different visual contexts.
The resulting maps are clean, readable, and well suited for showing routes, trajectories, and spatial sequences in a controlled and reproducible way.
Static images and animated maps
Beyond static PNG or JPG output, the same rendering pipeline can generate animated GIFs. This makes it possible to visualize progressions, ordered routes, or temporal changes as animated maps, without switching tools or formats.
Because the output is image-based, these maps integrate naturally into documentation, reports, and publishing pipelines, while remaining fully reproducible from source data.
Tutorials and Examples
-
libgd-gis Documentation
Overview, concepts, and complete examples for building maps with Ruby.
-
Points Map Rendering
Fully working example for rendering GeoJSON points with icons, numeric and alphabetic markers.
-
MultiLineString Map Rendering
Example focused on rendering routes and paths with precise control over line styles and layout.
Ruby as a cartography tool
These examples highlight a simple idea: Ruby can be used directly to make maps, not as an intermediary layer, but as the tool that builds the final visual result.
By working from GeoJSON, defining styles declaratively, and rendering images deterministically, this approach covers a wide range of cartographic needs—points, routes, labels, styling, and animation—without relying on external services or complex pipelines.
It is a practical way to build maps that look right, behave predictably, and can be regenerated at any time from the same inputs.