January 9, 2026
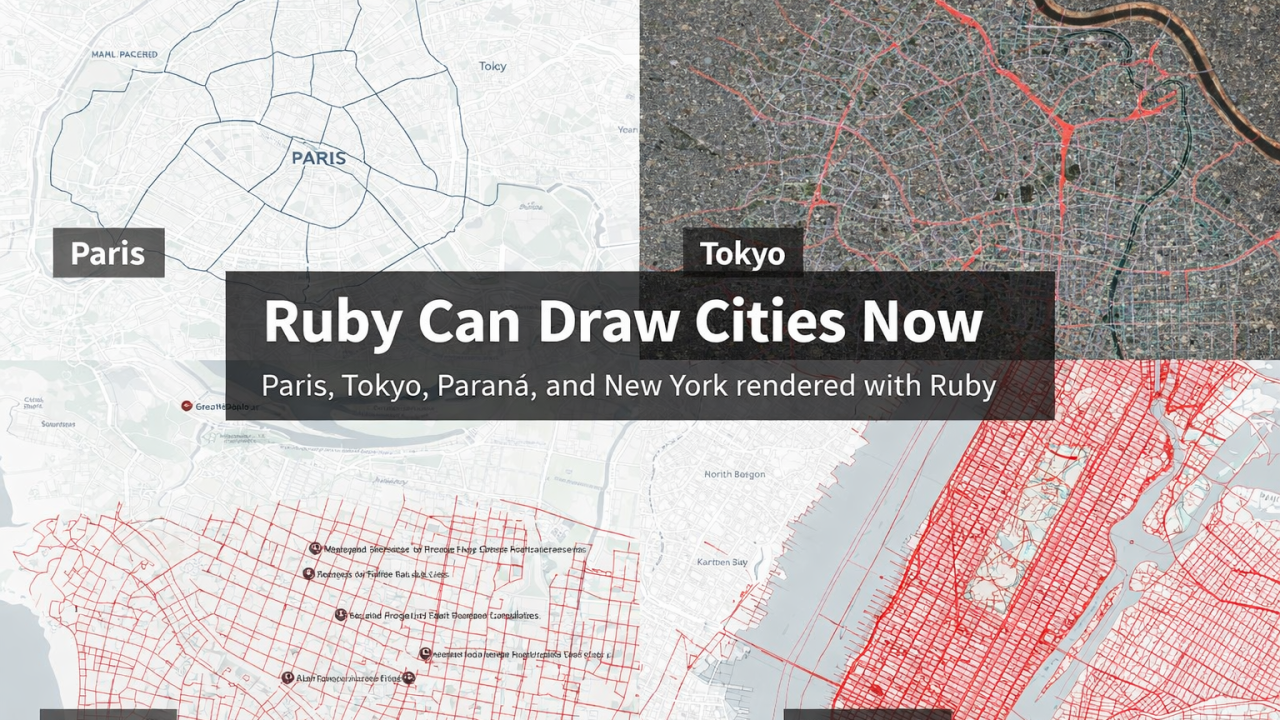
How I built a pure-Ruby GIS engine that renders Paris, Tokyo, New York, and more
Most people don’t think of Ruby when they think about maps, GIS, or visual computing. If you want to draw a real city, the standard stack usually looks like:
- QGIS
- PostGIS
- Mapnik
- Mapbox
- or a heavy JavaScript pipeline
But I wanted something different.
I wanted to know:
Can Ruby draw real cities — using real geospatial data — with no external GIS stack?
So I tried. And it worked.
What you see in the images above — Paris, Tokyo, Paraná, and New York — was rendered entirely in pure Ruby using two libraries I built:
- ruby-libgd – modern native bindings to the GD graphics engine
- libgd-gis – a GIS rendering pipeline built on top of it
This article explains how it works and why it matters.

The problem with maps in most stacks
Most GIS pipelines are huge:
- A spatial database
- A tile server
- A rendering engine
- A web front-end
That makes sense for Google Maps. But it is overkill if all you want is:
- a PNG map for a report
- a PDF
- a static website
- a Rails app
- a data visualization
- or a nightly generated map
Ruby had no way to do this natively.
So I built one.
SPONSOR LOGISTIC INTELLIGENCE:

The pipeline
At the core, a GIS renderer is surprisingly simple:
GeoJSON → Projection → Raster → PNG
libgd-gis implements exactly this:
- Load GeoJSON (streets, boundaries, rivers, parks, etc)
- Project latitude/longitude into Mercator coordinates
- Convert projected coordinates into pixels
- Draw them using GD
All of this happens inside Ruby.
No Node. No PostGIS. No QGIS. No Mapbox.
Just Ruby.
A minimal example
Here is a simplified version of what renders a city:
require "gd/gis"

TOKYO = [139.68, 35.63, 139.82, 35.75]

map = GD::GIS::Map.new(
  bbox: TOKYO,
  zoom: 13,
  basemap: :esri_satellite
)

map.add_geojson(
  "railways.geojson",
  color: [255, 80, 80]
)

map.add_geojson(
  "parks.geojson",
  color: [80, 200, 120, 120]
)

map.render("tokyo.png")
That is all it takes.
The projection math, clipping, scaling, rasterization, and alpha blending all happen inside GD.

What the cities prove
Each city tests a different aspect of the engine.

Paris
Paris is radial and irregular. Rendering its arrondissements proves polygon handling, joins, and clipping are correct.
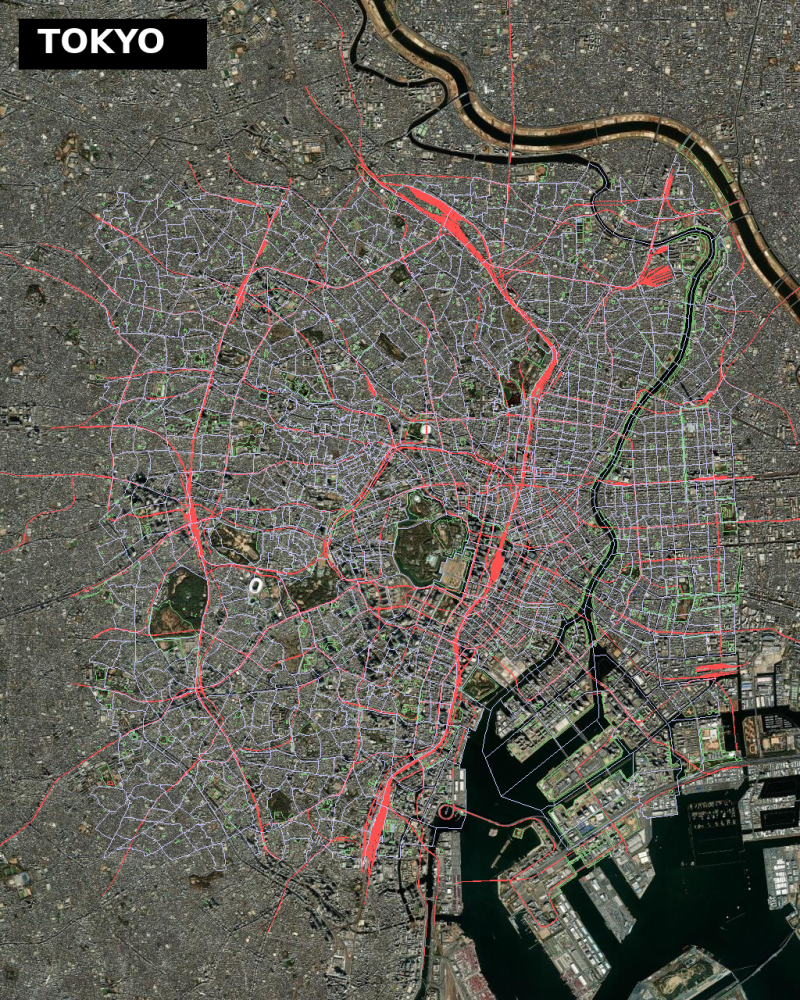
Tokyo
Tokyo is extremely dense and full of curves, railways, and rivers. Rendering it proves the projection and alignment against satellite imagery is accurate.
Paraná (Argentina)
This is real municipal OpenStreetMap data — messy, inconsistent, and dense. It proves the pipeline works for real-world civic data, not just demo cities.
New York
New York is a performance stress test: tens of thousands of line segments. It proves ruby-libgd and libgd-gis can handle megacity-scale datasets.
Why this matters
This unlocks something Ruby never had before:
Scriptable GIS rendering.
You can now:
- Generate maps in Rails
- Export them to PDFs
- Use them in reports
- Render them in CI
- Build static GIS sites
- Automate map generation
Without a single external GIS dependency.
This is huge for:
- data science
- civic tech
- urban planning
- journalism
- logistics
- research
The libraries
Both libraries are open source:
🟥 ruby-libgd
Native Ruby raster engine with alpha blending, image scaling, filters and pixel-level drawing.
RubyGems Source code🗺️ libgd-gis
GIS rendering for Ruby: basemaps, lines, polygons and projections built on top of ruby-libgd.
RubyGems Source codeThey are still young, but the core is solid — as the cities above prove.
Final thought
I did not set out to build a GIS engine. I just wanted to see how far I could push Ruby.
It turns out: far enough to draw cities.
And that opens a lot of doors.
If you like Ruby, maps, or data visualization — this is just the beginning.


One thought on “Ruby Can Draw Cities Now”