March 30, 2026
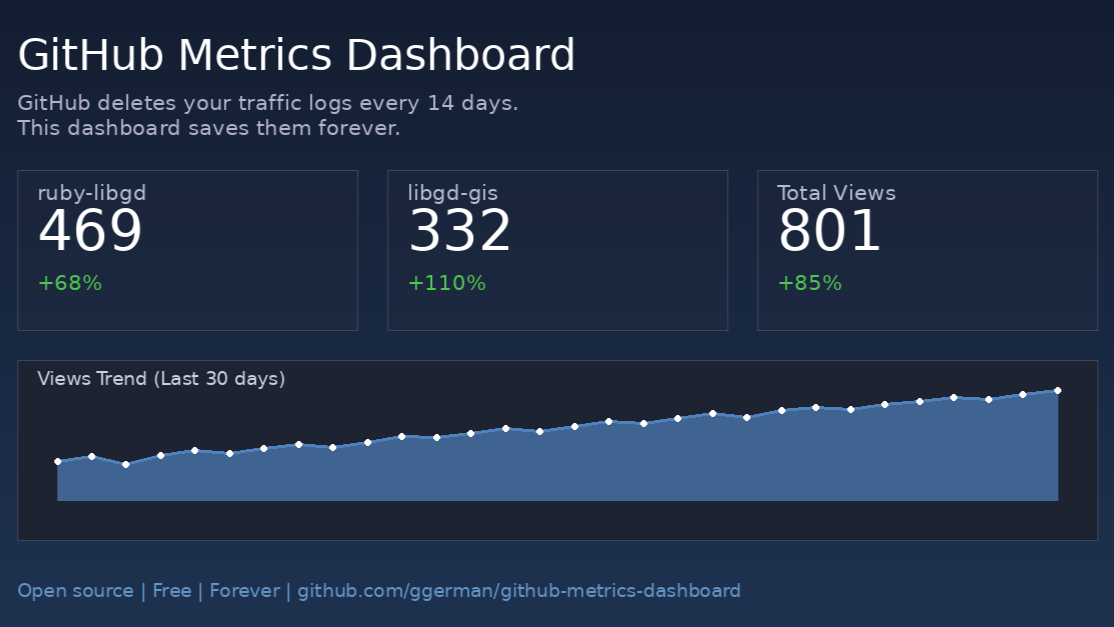
Motivation: I didn’t want to lose the metrics for ruby-libgd and libgd-gis. So I built an app that stores all logs and generates custom charts using ruby-libgd.
📊 What You’ll Get
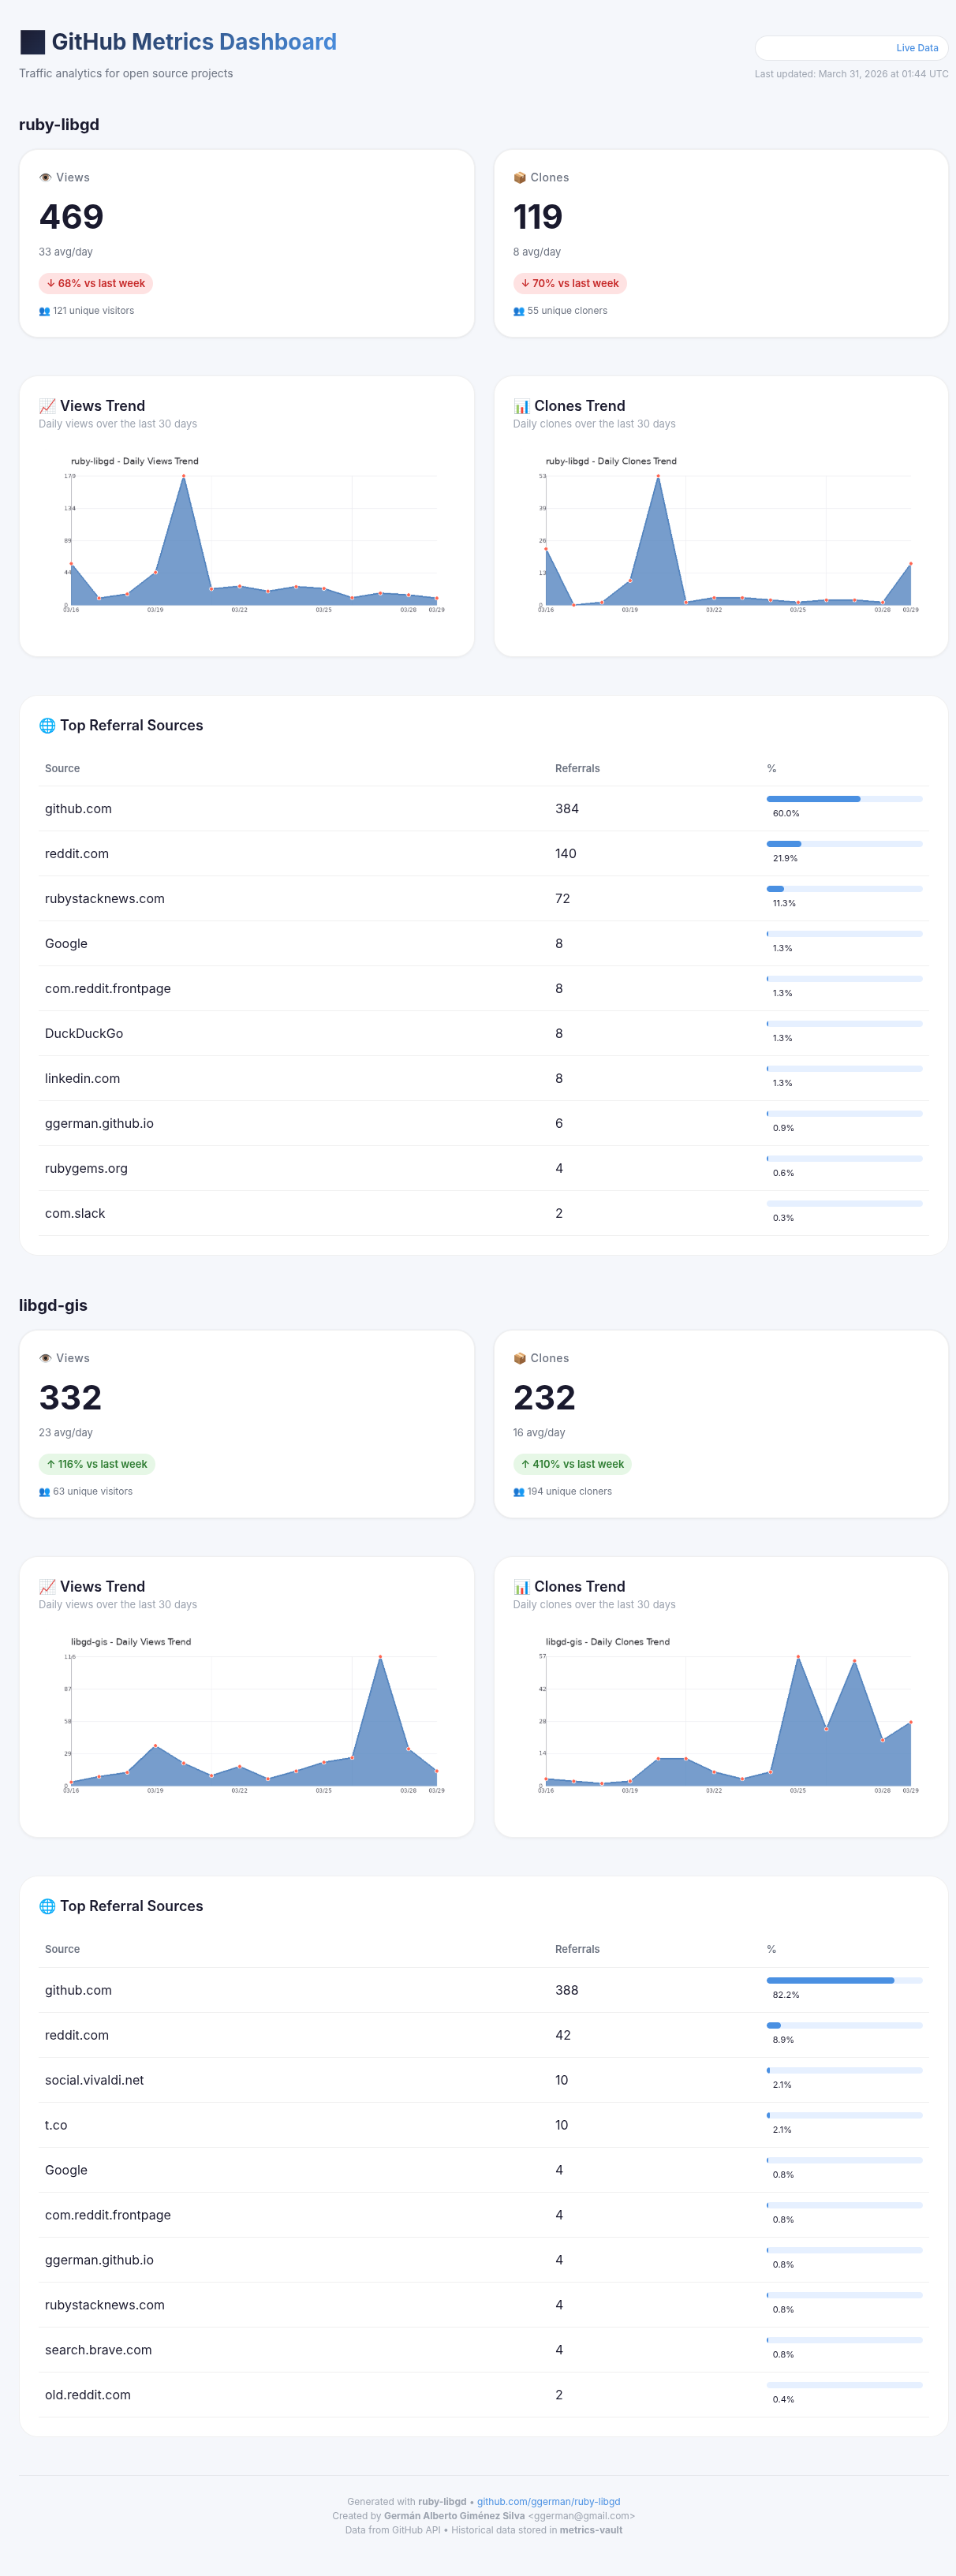
A dashboard like this:
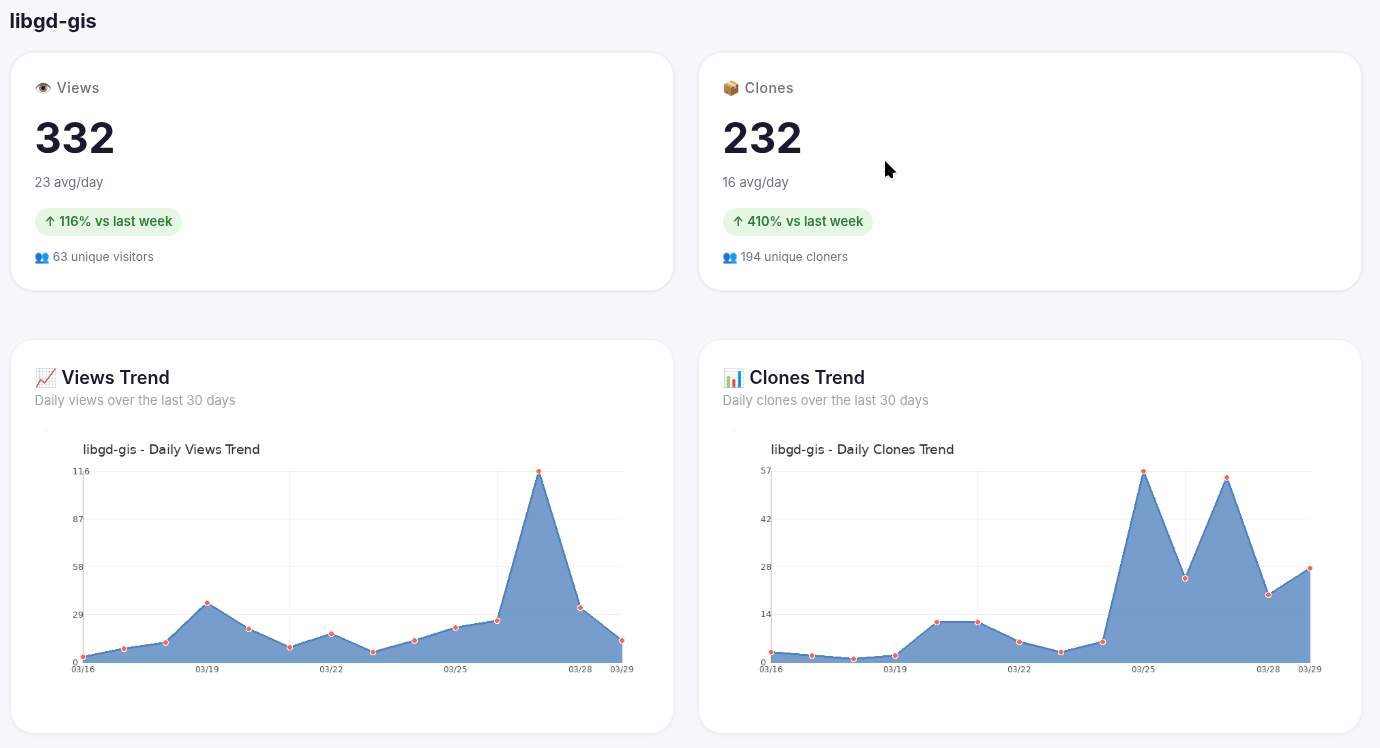
- Historical metrics (not just 14 days)
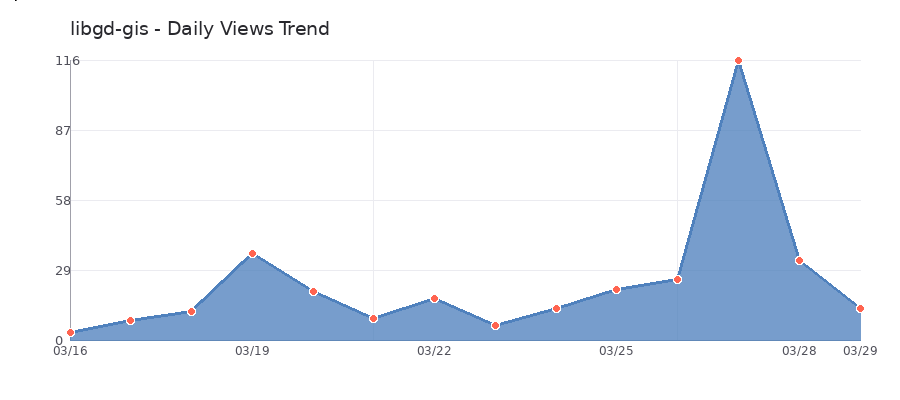
- Views and clones charts
- Top referral sources
- Daily automatic updates
🛠️ How It Works
GitHub API → GitHub Actions (daily) → Private repo (CSV) → Dashboard HTML + charts
- Archive Metrics (daily): saves views, clones, and referrers to CSV
- Generate Dashboard (weekly or manual): generates HTML and charts
- GitHub Pages: publishes the dashboard automatically
🚀 Quick Tutorial (5 Steps)
1. Clone the repository
git clone https://github.com/ggerman/github-metrics-dashboardcd github-metrics-dashboard
2. Configure your repositories
Edit config.yml:
repositories: - owner: your_username name: your_repo display_name: My Project description: "Brief description"
3. Create a GitHub token
- Settings → Developer settings → Personal access tokens → Tokens (classic)
- Permissions: repo
- Copy the token
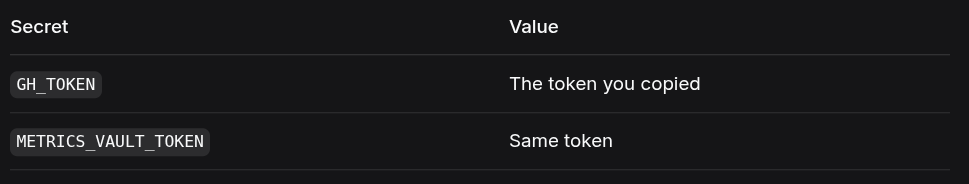
4. Add secrets to your repository
Settings → Secrets and variables → Actions:
5. Enable GitHub Pages
Settings → Pages → Source: GitHub Actions
Then run the workflows manually from the Actions tab:
- Archive Metrics → Run workflow
- Generate Dashboard → Run workflow
🎯 Final Result
Visit https://your_username.github.io/github-metrics-dashboard/ and you’ll see:
- Cards with total views and clones
- Trend charts
- Top referral sources
- Data that never disappears after 14 days
Example: https://ggerman.github.io/github-metrics-dashboard/
🧡 Stuck? Need Help?
Contact me directly: ggerman@gmail.com or https://rubystacknews.com/get-in-touch/
I’ll help you get it running.
📦 Resources
- github.com/ggerman/github-metrics-dashboard
- ruby-libgd – Pure Ruby charts
- libgd-gis – GIS maps in Ruby
Enjoy your repository metrics (forever) 🚀