March 12, 2026
A Ruby Developer’s Guide to
TracePoint, ISeq, and why your choice of debugger affects more than just comfort
If you write Ruby, you debug Ruby. Whether it’s a subtle off-by-one error in a data pipeline or a race condition buried in a Rails controller, debugging is as much a part of the job as writing code itself. Yet many Ruby developers reach for the nearest available tool without thinking much about how that tool actually works — or what it costs.
This guide breaks down the three most widely used Ruby debuggers — Byebug, the debug gem, and the RubyMine Debugger — from the inside out. Understanding their internals makes it easier to pick the right tool for the right situation, and to avoid some costly surprises.
What Does a Ruby Debugger Actually Do?
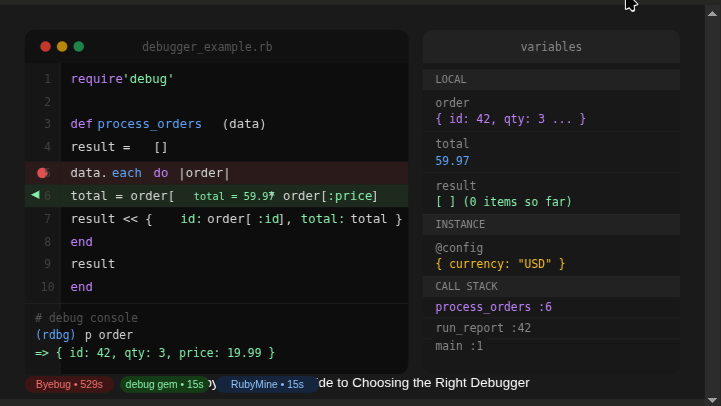
At its core, a debugger needs to do two things: pause execution at a specific location, and expose the program’s internal state at that point. In Ruby, both of these capabilities are built on top of VM-level primitives that the language exposes to library authors.
The two most important primitives are TracePoint and Instruction Sequences (ISeq). Every major Ruby debugger uses one or both of these — but the way they use them makes an enormous difference in performance and flexibility.
TracePoint
TracePoint, introduced in Ruby 2.0, is an event hook system built into the Ruby VM. It allows you to register a block of code that will be called whenever a specific event occurs during program execution: a line being evaluated, a method being called or returning, a class being opened, an exception being raised, and so on.
tp = TracePoint.new(:line) do |tp| puts "Executing #{tp.path}:#{tp.lineno}"endtp.enable { my_method }TracePoint is powerful and portable — it works in almost every execution context except inside Ractors. The catch is that a naively implemented TracePoint listener fires on every matching event across the entire program, which can introduce serious overhead.
Instruction Sequences (ISeq)
When Ruby parses source code, it compiles it into bytecode before execution. That bytecode is organized into Instruction Sequences — ISeq objects that represent compiled blocks of code (methods, blocks, the top-level script, etc.).
ISeqs give debuggers a way to work at a lower level than TracePoint: instead of subscribing to a stream of runtime events, a debugger can inspect the bytecode structure of a program and inject hooks at precise locations. This is what enables zero-overhead debugging on modern Ruby.
Byebug: Reliable, But at a Cost
Byebug has been the default debugger for Ruby 2.5–2.6 and Rails 5–6. It’s battle-tested, well-documented, and integrates with both the CLI and VS Code. For many teams it’s simply the debugger that came with the framework, and it has stayed there ever since.
How It Works
Byebug registers a global TracePoint listener that fires on every :line event across the entire running program. When execution reaches a line that matches a registered breakpoint, it pauses and starts an interactive session. Otherwise, it checks and discards the event.
This check-on-every-line model is simple and highly compatible, but it means the VM is constantly invoking Ruby-level code as overhead — even when no breakpoint will ever be reached on that path.
The Performance Reality
In benchmarks, attaching Byebug to a program with no active breakpoints increased runtime from 17.7 seconds to 529.1 seconds — a roughly 30x slowdown.
The numbers below are from a controlled benchmark using a representative Ruby workload (Ruby 2.6.10 and 3.4.2, latest stable versions of each debugger):
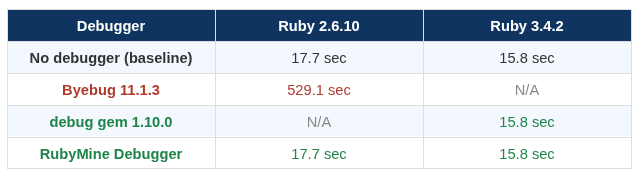
The implication is significant: on any non-trivial Rails application, running under Byebug in development — even without hitting a single breakpoint — will meaningfully slow down your feedback loop.
When to Still Use Byebug
Byebug remains a reasonable choice if you are constrained to Ruby 2.5–2.6 and cannot upgrade. For everything else, there are better options.
The debug Gem: Modern, Fast, and Built In
The debug gem was designed around a key improvement made to TracePoint in Ruby 2.6: the ability to enable a TracePoint for a specific target line or ISeq rather than globally. This changes the performance equation entirely.
Targeted TracePoint
Instead of registering a listener that fires on every line event, the debug gem enables TracePoint only at the exact bytecode location corresponding to a breakpoint. When no breakpoints are active, no TracePoint listener runs at all — the VM overhead is zero.
# Conceptually, the debug gem does something like this:tp = TracePoint.new(:line) { handle_breakpoint }tp.enable(target: target_iseq, target_line: 42)# Only fires at line 42 of target_iseq — nowhere elseThis targeted approach requires knowing the ISeq corresponding to the source location of a breakpoint, which the gem resolves at setup time.
Key Characteristics
- Zero performance overhead when no breakpoints are active
- Supports Ruby 2.7 and above
- Multiple GUI frontends: VS Code via DAP protocol, Chrome DevTools
- Bundled with Ruby 3.1+ — no gem installation required
- Supports attaching to an already-running Ruby process
For most developers on Ruby 2.7 or newer, the debug gem is the natural first choice: fast, well-supported, and increasingly the standard.
RubyMine Debugger: Integrated and Full-Featured
The RubyMine Debugger is JetBrains’ bundled debugger for the RubyMine IDE. It takes a similar ISeq-based approach but extends zero-overhead debugging all the way back to Ruby 2.3 — including versions that predate the targeted TracePoint API.
Architecture
For Ruby versions that support targeted TracePoint, the RubyMine debugger uses it. For older versions, it uses direct ISeq manipulation: it modifies the compiled bytecode to insert breakpoint hooks without relying on TracePoint at all. This gives it the broadest compatibility range of any major Ruby debugger while maintaining consistent performance.
The debugger runs as a separate process (ruby-debug-ide + debase) that communicates with the IDE over a socket, exposing stack frames, variable bindings, and control commands through a structured protocol.
Productivity Features
Beyond performance, RubyMine adds several features not available in CLI-based debuggers:
- automatically skips over gem and standard library code when stepping through your own application, preventing you from accidentally descending into Rails internalsSmart stepping:
- displays the current value of variables directly in the editor source view, overlaid on the code as you step — no need to switch panels or evaluate expressions manuallyInline debugger values:
- launch configurations for Rails apps, Rake tasks, RSpec/Minitest runs, and more are preconfigured and launchable directly from the IDEOne-click Rails debugging:
- connect the debugger to any already-running Ruby process by PIDAttach to process:
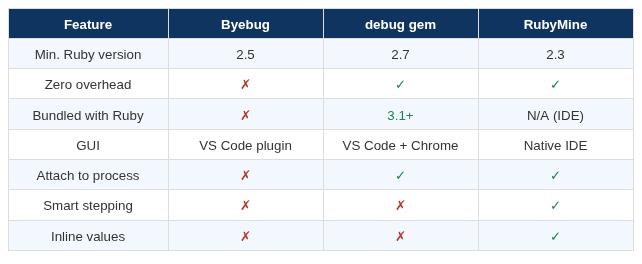
Side-by-Side Comparison
Here is a feature comparison across the three debuggers to help you evaluate which fits your context:
How to Choose
The right debugger depends on your Ruby version, your tooling setup, and what you need from the debugging experience.
- Byebug is your only real option — just be aware of the performance cost and avoid running it in scenarios where throughput mattersRuby 2.5–2.6, legacy constraint:
- use the debug gem. It’s fast, bundled since Ruby 3.1, and increasingly the community standardRuby 2.7+ in VS Code or terminal:
- the RubyMine Debugger offers the broadest version support with zero overhead, plus smart stepping and inline values that make complex debugging sessions significantly fasterRuby 2.3+ with a GUI-first workflow:
A useful rule of thumb: if you’re spending noticeable time navigating around library internals or switching between the editor and a debug console, the RubyMine Debugger’s smart stepping and inline values will reclaim that time quickly.
Final Thoughts
Ruby’s debugging ecosystem has matured considerably. The shift from Byebug’s global TracePoint model to targeted ISeq-based approaches represents a fundamental improvement — one that makes debugging a near-zero-cost operation rather than a 30x performance tax.
Regardless of which tool you choose, understanding the internals helps you reason about what your debugger is actually doing at runtime: when it’s active, when it’s silent, and where its overhead comes from. That understanding is what turns a debugging session from guesswork into a reliable, efficient process.

Further Reading
Dmitry Pogrebnoy — Demystifying Ruby Debuggers: A Deep Dive into Internals, RubyKaigi 2025: rubykaigi.org/2025/presentations/DmitryPogrebnoy.html
Ruby TracePoint documentation: ruby-doc.org/core/TracePoint.html
debug gem repository: github.com/ruby/debug
