January 27, 2026
From Disaster Prevention to High-Performance Maps
On December 26, 2025, I published an article titled “Ruby at the Front Line of Disaster Prevention.” It was inspired by a real, uncomfortable fact: Tokyo Gas uses Ruby to protect millions of people during earthquakes.
Not in theory. Not as a prototype. In production.
That story stuck with me — but not for the reasons most people noticed.
Inspiration: Tokyo Gas Uses Ruby to Protect Millions of People During Earthquakes
The article described how Tokyo Gas reacts in real time when seismic activity is detected:
- Thousands of sensors measure ground motion
- Data is transmitted instantly
- The gas network is segmented into blocks
- Only unsafe areas are shut down
- Safe areas remain operational
- Restoration happens remotely, without sending technicians
It’s an impressive system. And Ruby plays a central role in it.
But buried in that article was a paragraph that genuinely worried me.
The Hard Parts (and the Problem No One Wanted to Fix)
The team behind the system was honest about Ruby’s weaknesses:
Generating map tiles and images on the server is difficult:
That paragraph stayed with me.
Because disaster prevention is not optional. And maps are not a “nice to have” — they are core infrastructure.
At that moment, Ruby was doing the decision-making… …but struggling with the visualization.
That felt wrong.
The Gap: Ruby Could Decide, But Not Render
Ruby was already trusted with:
- real-time seismic decisions
- critical infrastructure control
- systems affecting millions of lives
Yet when it came to rendering a map, the ecosystem fell apart.
That gap became impossible to ignore.
So I started asking a simple question:
What if rendering maps in Ruby was actually… easy?
Not via web tiles. Not via heavy GIS stacks. Not via external services.
Just Ruby. Offline. Deterministic. Fast.
What Changed Since ThenWhat Changed Since Then
Today, the situation is different.
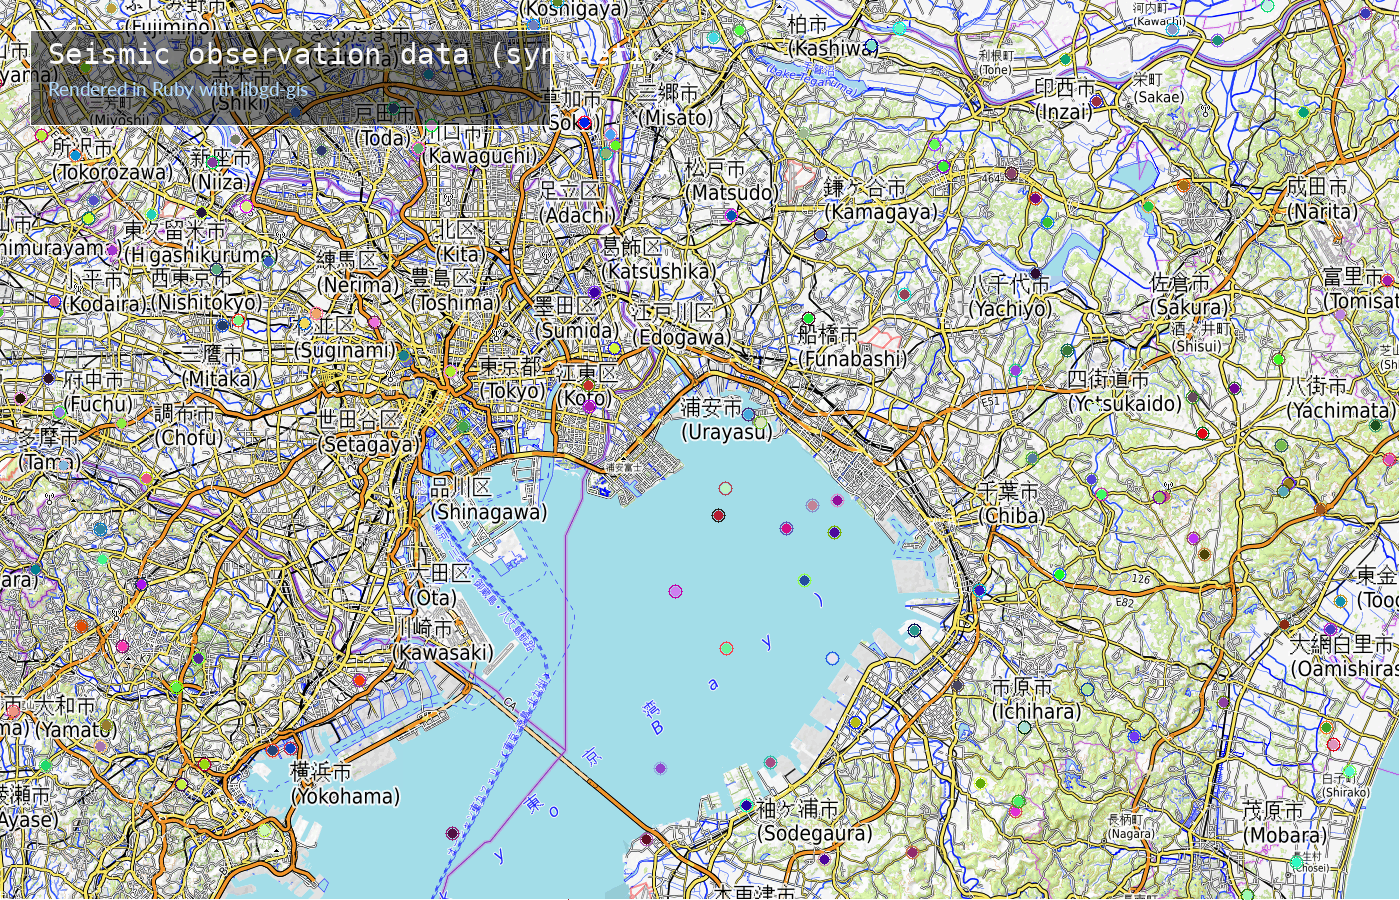
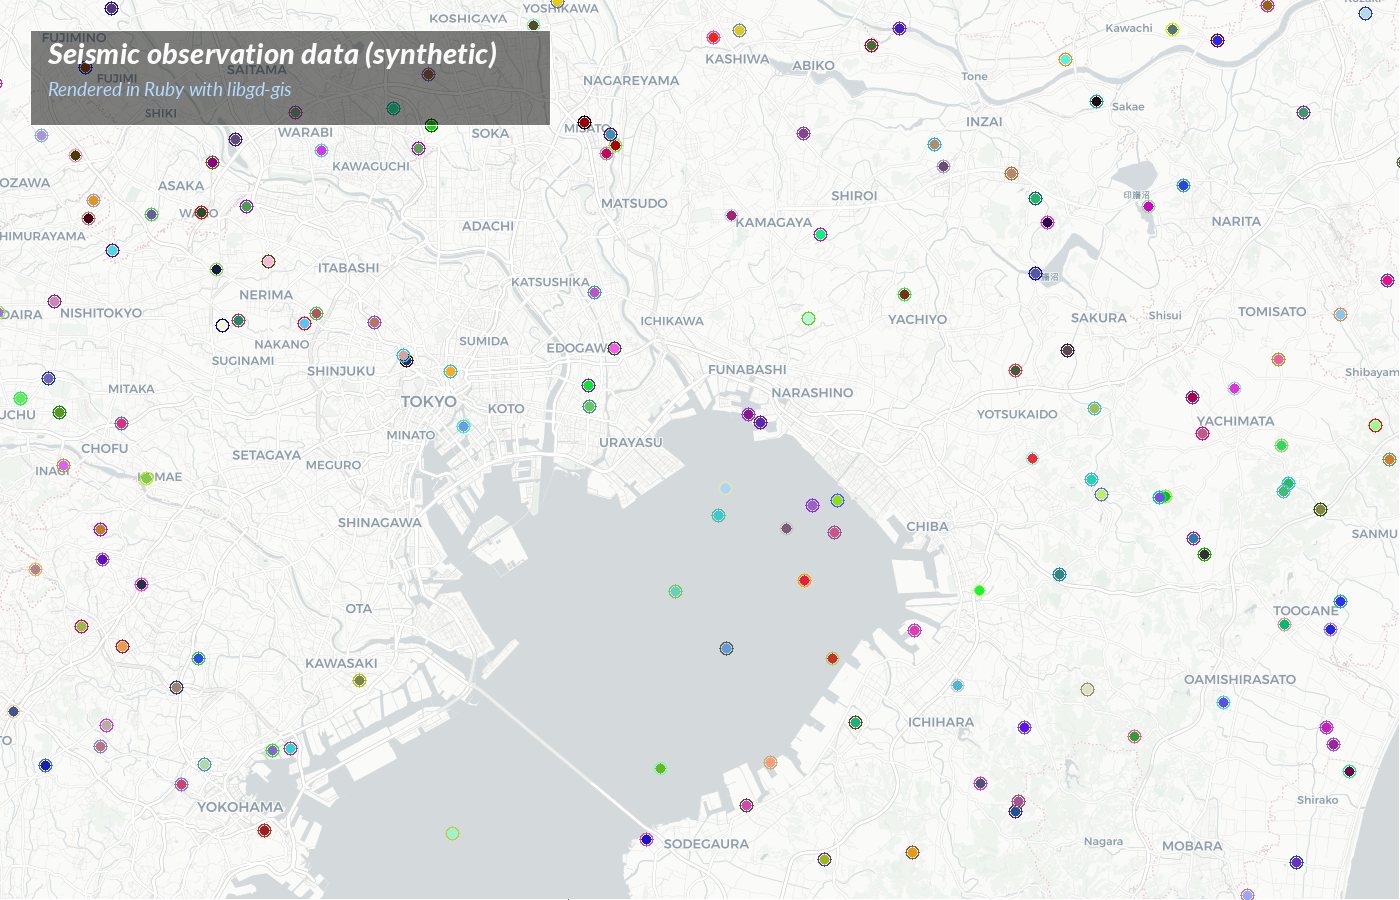
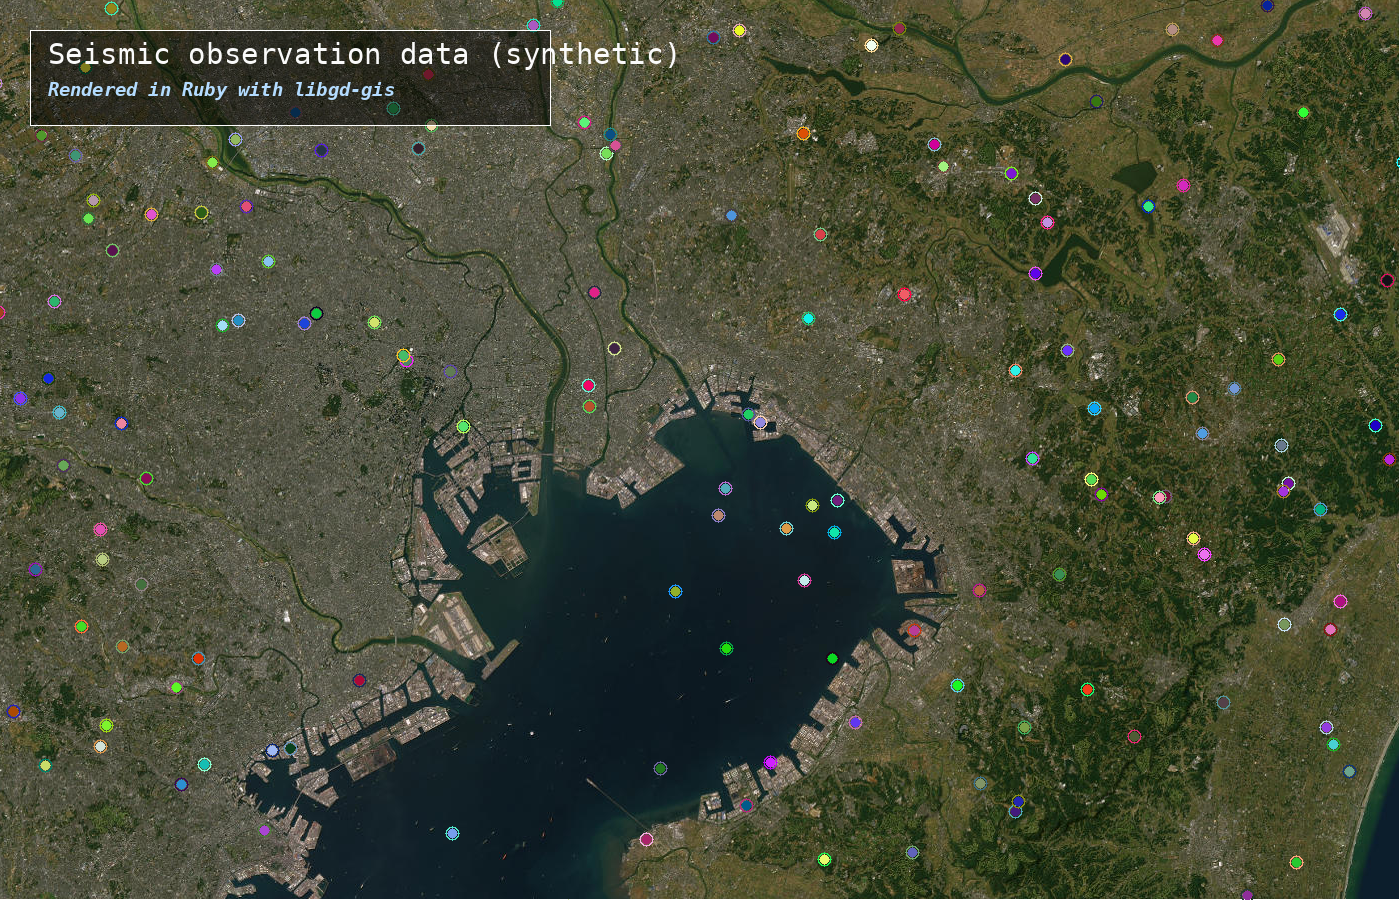
Using libgd, ruby-libgd, and libgd-gis, rendering maps from GeoJSON is no longer a painful workaround — it’s straightforward.
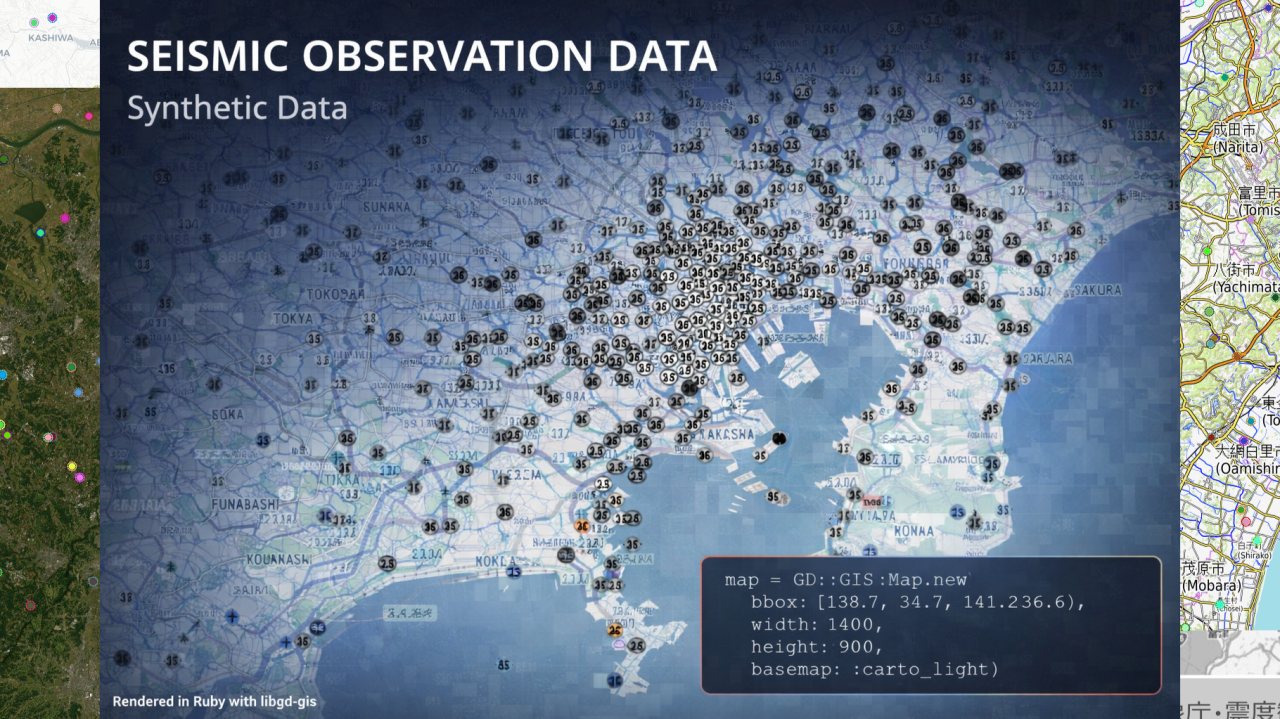
To make that concrete, here’s a minimal example that renders seismic observation points on a map, entirely in Ruby.
This is not a demo screenshot. It produces the image you saw above.
#!/usr/bin/env rubyrequire "date"require "gd/gis"require_relative "fonts"# ---------------------------------------# CONFIG# ---------------------------------------GEOJSON = ARGV[0] || "fake_jma_stations.geojson"OUT = "synthetic-seismic-#{DateTime.now.strftime('%Y%m%d-%H%M')}.png"WIDTH = 1400HEIGHT = 900# Kanto / Tokyo bboxBBOX = [ 138.7, # min lon 34.7, # min lat 141.2, # max lon 36.6 # max lat]# ---------------------------------------# MAP# ---------------------------------------map = GD::GIS::Map.new( bbox: BBOX, width: WIDTH, height: HEIGHT, zoom: 11, basemap: :carto_light)map.style = GD::GIS::Style.load("solarized")map.add_geojson(GEOJSON)map.renderimg = map.image# ---------------------------------------# LEGEND# ---------------------------------------def draw_legend(img) x, y = 30, 30 w, h = 520, 95 bg = GD::Color.rgba(0, 0, 0, 170) border = GD::Color.rgb(255, 255, 255) img.filled_rectangle(x, y, x + w, y + h, bg) img.rectangle(x, y, x + w, y + h, border) img.text( "Seismic observation data (synthetic)", x: x + 18, y: y + 34, size: 22, color: GD::Color::rgb(250, 250, 250), font: GD::Fonts.random ) img.text( "Rendered in Ruby with libgd-gis", x: x + 18, y: y + 66, size: 14, color: GD::Color.rgb(180, 220, 255), font: GD::Fonts.random )enddraw_legend(img)# ---------------------------------------# OUTPUT# ---------------------------------------img.save(OUT)puts "✔ image generated: #{OUT}"No tiles. No browser. No JavaScript. No GIS server.
Just Ruby rendering a map.
Why This Matters (Beyond the Screenshot)
The data shown here is synthetic — intentionally so. But the pipeline is real.
And that distinction matters.
Because the question is no longer “Can Ruby do this?” The question is:
Why aren’t we using Ruby for this more often?
When Ruby can already be trusted with:
- disaster response
- infrastructure safety
- real-time decisions
There is no reason it shouldn’t also handle:
- map rendering
- geospatial visualization
- offline, deterministic imagery
Especially when lives depend on it.
From Concern to Capability
That paragraph from December 26, 2025 was a wake-up call.
It exposed a real weakness — and weaknesses are where ecosystems grow.
Today, rendering maps in Ruby is no longer an afterthought. It’s a viable, practical option.
And once you see Ruby render something that looks like national-agency infrastructure, it’s hard to unsee it.
Closing Thought
Disaster prevention systems don’t need trendy stacks. They need boring, reliable, understandable tools.
Ruby has always been good at that.
Now, it can draw the map too.