January 23, 2026
Raster maps, GeoJSON overlays, and real-world cartography — without leaving Ruby.
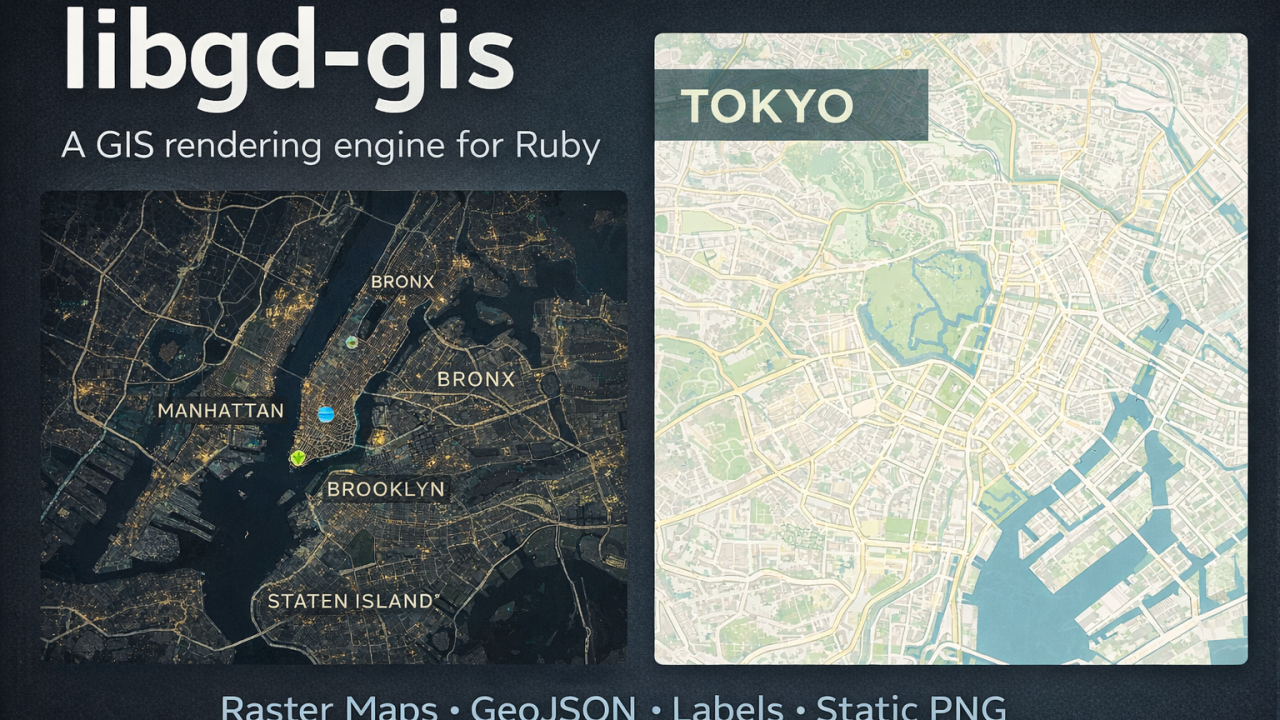
Over the last months, I’ve been working on libgd-gis, a GIS rendering engine built on top of libgd and designed specifically for Ruby developers who need static map generation without relying on browser-based toolchains or heavyweight GIS stacks.
This article walks through the motivation, architecture, and recent features — including native GeoJSON Point support — illustrated with real examples.
Why libgd-gis?
Ruby has excellent libraries for data processing, APIs, and background jobs — but when it comes to map rendering, the ecosystem is thin:
- Browser-based stacks (Mapbox GL, Leaflet) require JS, tileservers, and headless rendering
- Traditional GIS tools (GDAL, QGIS) are powerful but heavy and non-Ruby-native
- Generating static images for reports, thumbnails, PDFs, or background jobs is surprisingly hard
libgd-gis was created to fill that gap:
A server-side, Ruby-native GIS engine for generating static maps using raster tiles and vector overlays.
Core Design Goals
- ✅ Pure Ruby API
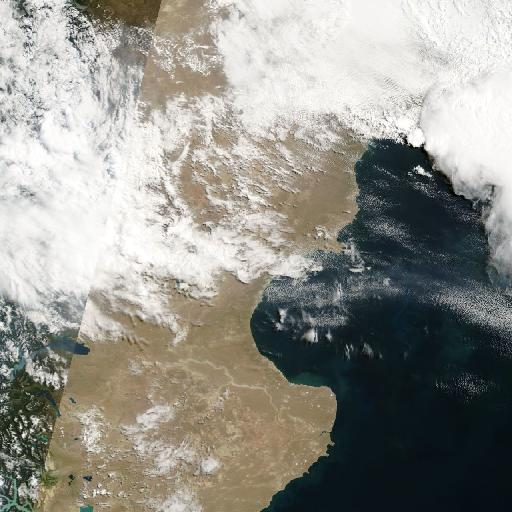
- ✅ Raster basemaps (OSM, CARTO, ESRI, etc.)
- ✅ GeoJSON overlays (lines, polygons, points)
- ✅ Deterministic image output
- ✅ No browser, no JS, no headless Chrome
- ✅ Suitable for background jobs, reports, and automation
Advertise on RubyStackNews
RubyStackNews is a niche publication read by Ruby and Rails developers worldwide. Our audience includes senior engineers, tech leads, and decision-makers from the US, Europe, and Asia.
Sponsorship Options
Your brand featured inside a technical article (clearly marked as sponsored).
Highlighted sponsor section embedded within an article.
Logo + link displayed site-wide in the sidebar.
- Highly targeted Ruby / Rails audience
- Organic traffic from search and developer communities
- No ad networks — direct sponsorships only
Interested in sponsoring RubyStackNews?
ContactRendering Model
libgd-gis follows a simple but powerful pipeline:
- Define a geographic bounding box (WGS84)
- Select a basemap provider
- Load vector layers (GeoJSON, points, CSV data)
- Render to a PNG image
- (Optional) draw post-render overlays (labels, legends, titles)
map = GD::GIS::Map.new( bbox: [-74.02, 40.70, -73.93, 40.82], zoom: 14, basemap: :carto_light)map.style = GD::GIS::Style.load("default")map.add_geojson("streets.geojson")map.add_geojson("parks.geojson")map.rendermap.save("nyc.png")Basemap Support
libgd-gis supports a wide range of tile providers out of the box:
- OpenStreetMap (:osm)
- CARTO (:carto_light, :carto_dark)
- ESRI Satellite / Streets
- Stamen (Toner, Terrain, Watercolor)
- OpenTopoMap
- Wikimedia
- CyclOSM
Tiles are fetched, cached locally, and stitched into a single image using libgd.
Styles Are Mandatory (By Design)
One important design decision: a style is mandatory for rendering.
This keeps the rendering pipeline explicit and predictable. Styles define:
- Layer order
- Stroke and fill colors
- Line widths
- Text and label behavior
Styles are loaded from YAML and applied consistently across maps.
map.style = GD::GIS::Style.load("solarized")This approach avoids “magic defaults” and makes map output reproducible.
GeoJSON Support (Lines, Polygons… and Now Points)

Originally, libgd-gis focused on line and polygon geometries (roads, rivers, parks, administrative boundaries).
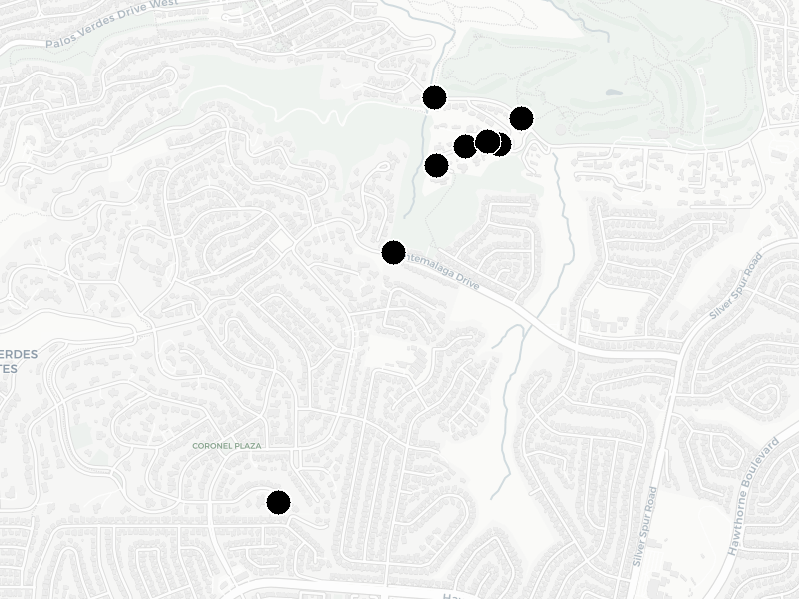
✨ New: GeoJSON Point Support
Recent versions introduce native support for GeoJSON Point features.
This allows you to:
- Render POIs directly from GeoJSON
- Mix points, lines, and polygons in the same dataset
- Attach icons and labels to point features
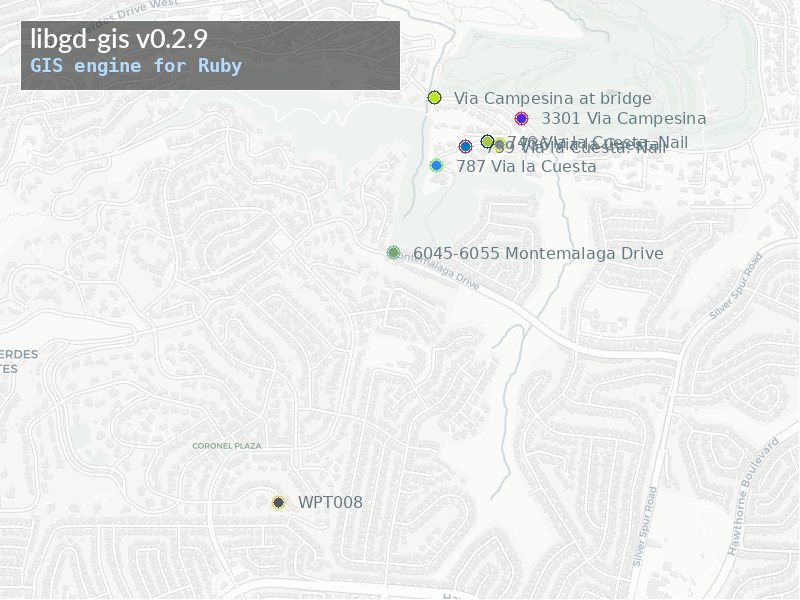
Example:
map.style = GD::GIS::Style.load("solarized")map.add_points( geojson["features"], lon: ->(f) { f["geometry"]["coordinates"][0] }, lat: ->(f) { f["geometry"]["coordinates"][1] }, icon: nil, label: ->(f) { f["properties"]["name"] }, font: "./fonts/DejaVuSans.ttf", size: 12)styles/default.yml
...points: icon: null font: "/usr/share/fonts/truetype/dejavu/DejaVuSans.ttf" size: 12 color: [101, 123, 131]...This closes an important gap and makes libgd-gis suitable for:
- City POI maps
- Sensor locations
- Infrastructure inventories
- Data journalism visuals
Viewport Rendering (Fixed Image Sizes)
By default, maps are rendered using a tile-based model, where the final image size depends on the number of tiles.
libgd-gis also introduces an opt-in viewport mode:
map = GD::GIS::Map.new( bbox: PARIS, zoom: 13, basemap: :carto_light, width: 350, height: 350) This allows:
- Exact image sizes (thumbnails, avatars, video frames)
- Deterministic output
- Tile cropping instead of tile stitching
Tile-based mode remains the stable default.
Post-Render Overlays
Because everything is rendered into a GD::Image, you can draw directly on the result:
map.rendermap.image.antialias = truemap.image.filled_rectangle(30, 30, 330, 100, bg)map.image.text("PARIS", x: 60, y: 85, size: 36, font: font) This makes it easy to add:
- Titles
- Legends
- Watermarks
- Annotations
Real-World Use Cases
libgd-gis is already being used for:
- Automated report generation
- Infrastructure and asset maps
- GIS thumbnails in background jobs
- Data exploration and visualization
- Static maps for PDFs and emails
All without leaving Ruby.
Project Status
- Language: Ruby
- Rendering: libgd
- Current version: 0.2.x
- Status: Actively evolving
- GeoJSON: Lines, polygons, and points supported
Feedback, issues, and contributions are very welcome.
👉 GitHub: https://github.com/ggerman/libgd-gis 👉 Issues: https://github.com/ggerman/libgd-gis/issues
Final Thoughts
libgd-gis doesn’t try to replace full GIS stacks or interactive web maps.
Instead, it focuses on a clear niche:
Generate high-quality static maps from Ruby — reliably, deterministically, and without browser dependencies.
If you’ve ever needed a map inside a background job, a PDF report, or a batch process, this tool might be exactly what you were missing.