January 12, 2026
Real-world cartography in pure Ruby
RubyStackNews — January 2026
From geometry to cities
Until recently, libgd-gis could render raw GeoJSON.
Now it renders cities.
Over the last development cycle, libgd-gis evolved from a low-level geometry renderer into a style-aware, layered GIS engine capable of producing publication-quality maps — directly from Ruby.
With the addition of:
- A style engine
- Layered GeoJSON
- The map.image drawing API
- A labeling system
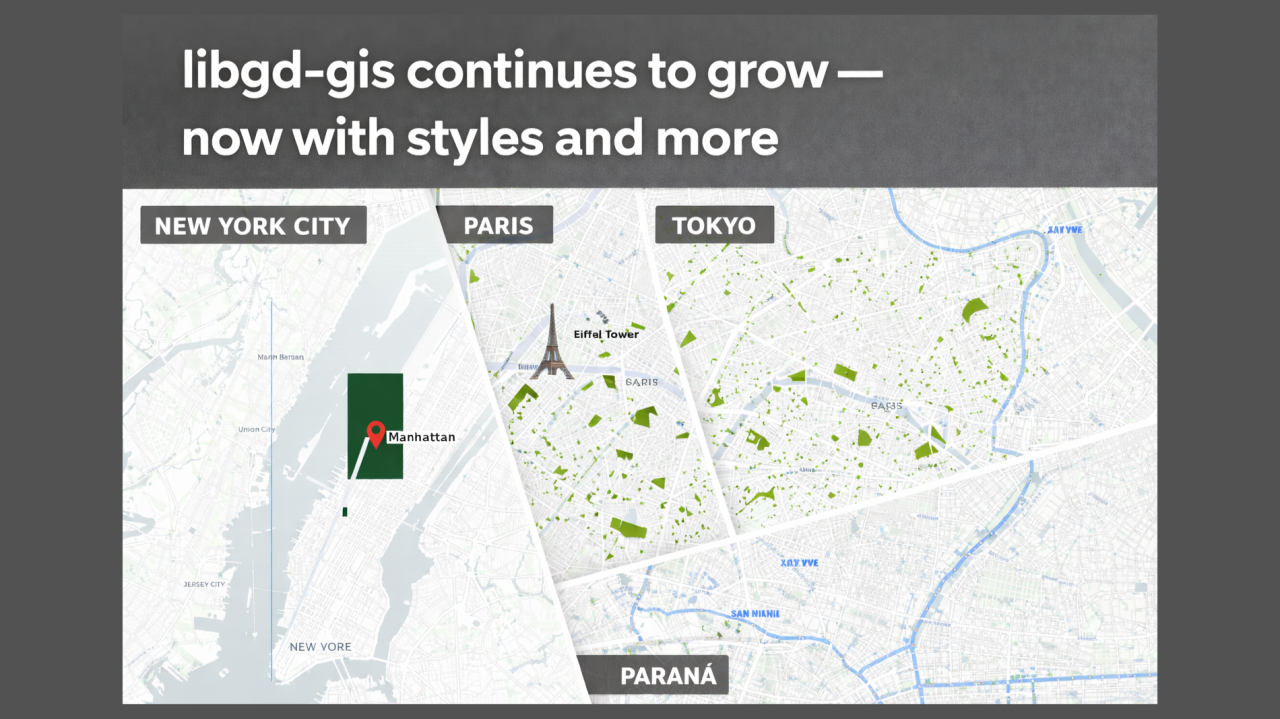
Ruby can now generate streets, rivers, railways, parks, points of interest, and full city layouts without Mapbox, without QGIS, and without JavaScript.
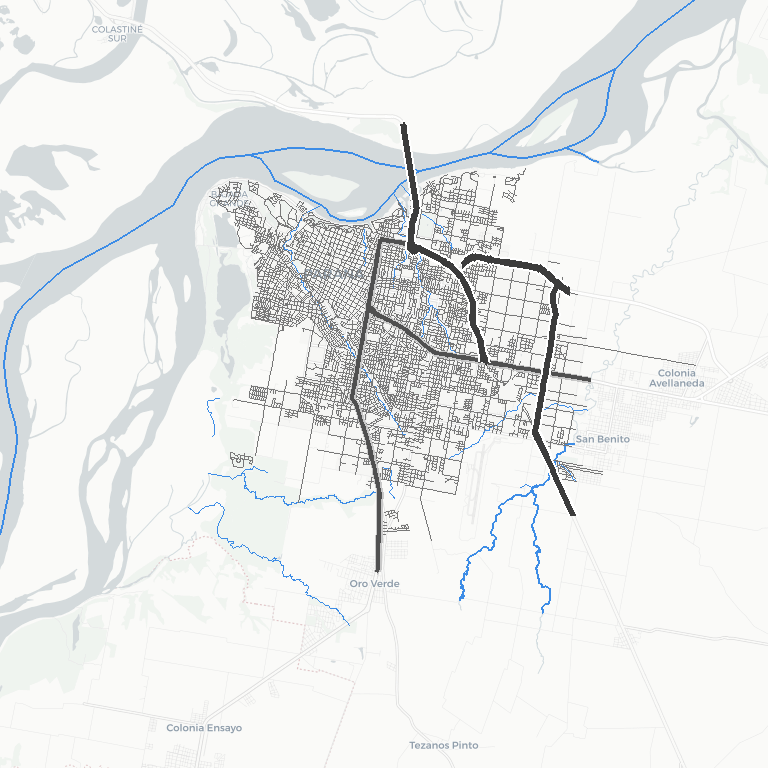
Everything shown in New York, Paris, Tokyo, and Paraná was rendered entirely in Ruby.
Styles — turning data into cartography
Raw GIS data is unreadable without visual hierarchy. A million lines mean nothing until they are styled.
libgd-gis now supports cartographic styles via YAML:
roads: motorway: stroke: [255,255,255] stroke_width: 10 fill: [60,60,60] fill_width: 6 primary: stroke: [200,200,200] stroke_width: 7 fill: [80,80,80] fill_width: 4water: stroke: [0,120,255] stroke_width: 6 fill: [0,90,200]Styles control:
- Color palettes
- Stroke and fill layers
- Line hierarchy
- Visual weight
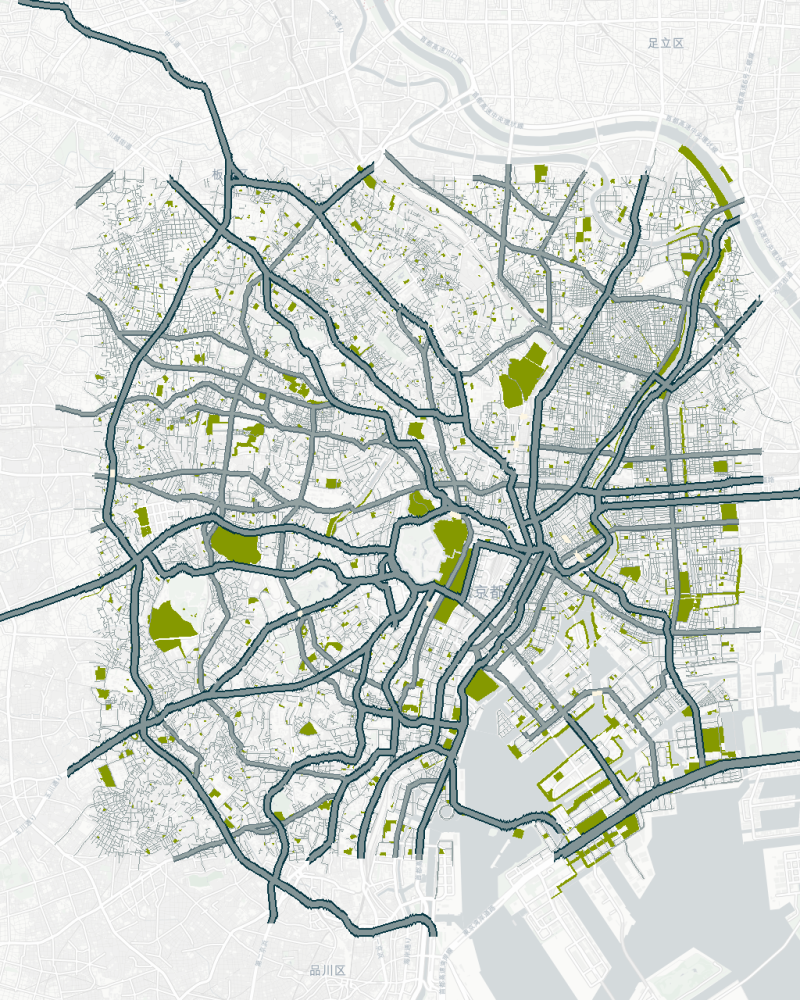
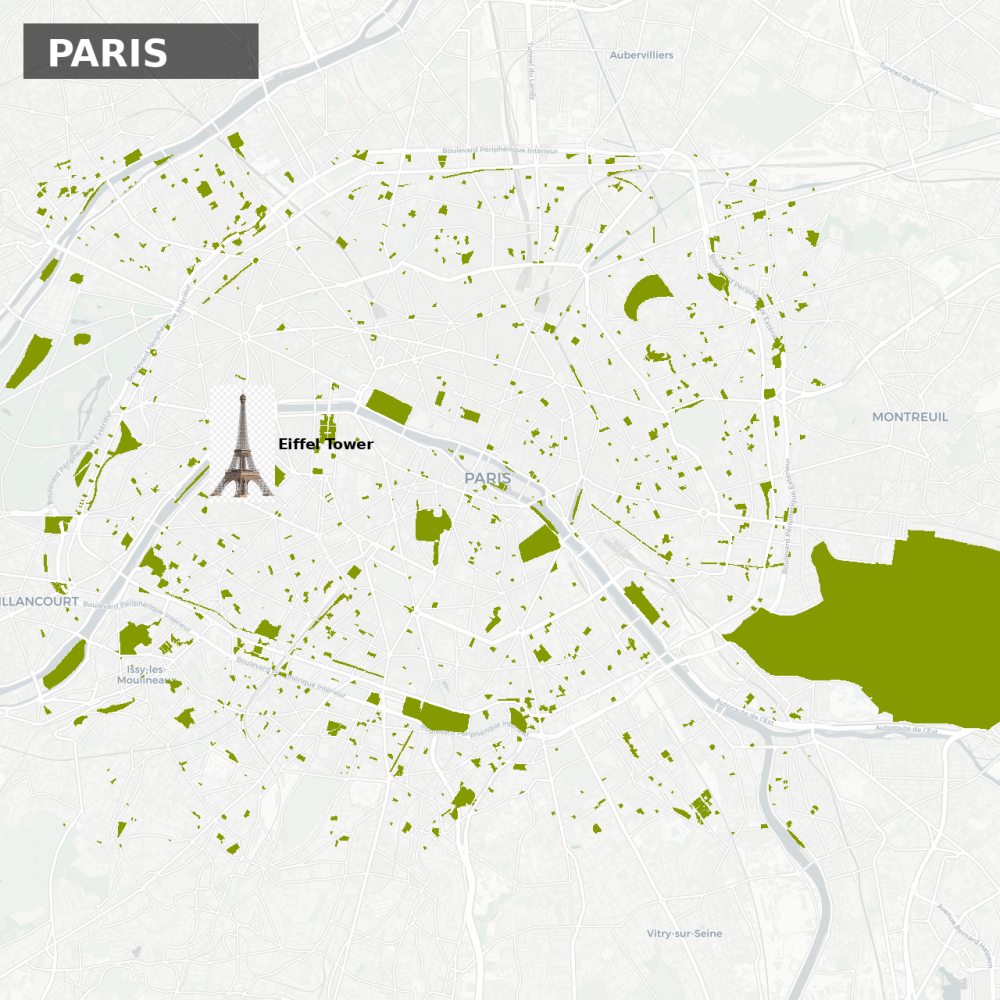
This is why Tokyo’s rivers read clearly, why Paris parks stand out, and why road networks acquire depth instead of noise.
GeoJSON as real layers
Instead of dumping everything into a single stream, libgd-gis now treats GeoJSON as semantic layers:
map.add_geojson("streets.geojson")map.add_geojson("railways.geojson")map.add_geojson("rivers.geojson")map.add_geojson("parks.geojson")Features are classified into:
- :roads
- :rail
- :water
- :landuse
- :points
This allows correct draw order, per-layer styling, and precise label placement. Rivers flow under bridges, rails sit above streets, and parks fill behind labels.
map.image — full graphic control
map.image exposes the raw GD canvas behind every map.
This allows you to draw UI elements, banners, and overlays directly on top of the GIS output:
map.image.filled_rectangle(x, y, x + w, y + h, [0,0,0,160])map.image.text(x + 20, y + 40, "PARIS", font: "Inter-Bold.ttf", size: 48, color: [255,255,255])This is how city titles, dark headers, watermarks, and branding are composited into the maps.
GIS and graphic design now live in the same Ruby pipeline.
Labels for roads, rivers, and places
The new labeling engine understands geometry type:
GeometryLabel behaviorLineString (roads, rivers)Text follows curvesPolygon (parks, areas)Centered labelsPointsIcon + name
map.add_geojson("rivers.geojson", labels: true)map.add_points(museums, label: ->(r){ r["name"] })map.add_geojson("wards.geojson", label_property: "name")This produces readable, non-overlapping labels for:
- Rivers
- Parks
- Neighborhoods
- Points of interest
Even in dense cities like Tokyo.
Real cities, rendered in Ruby
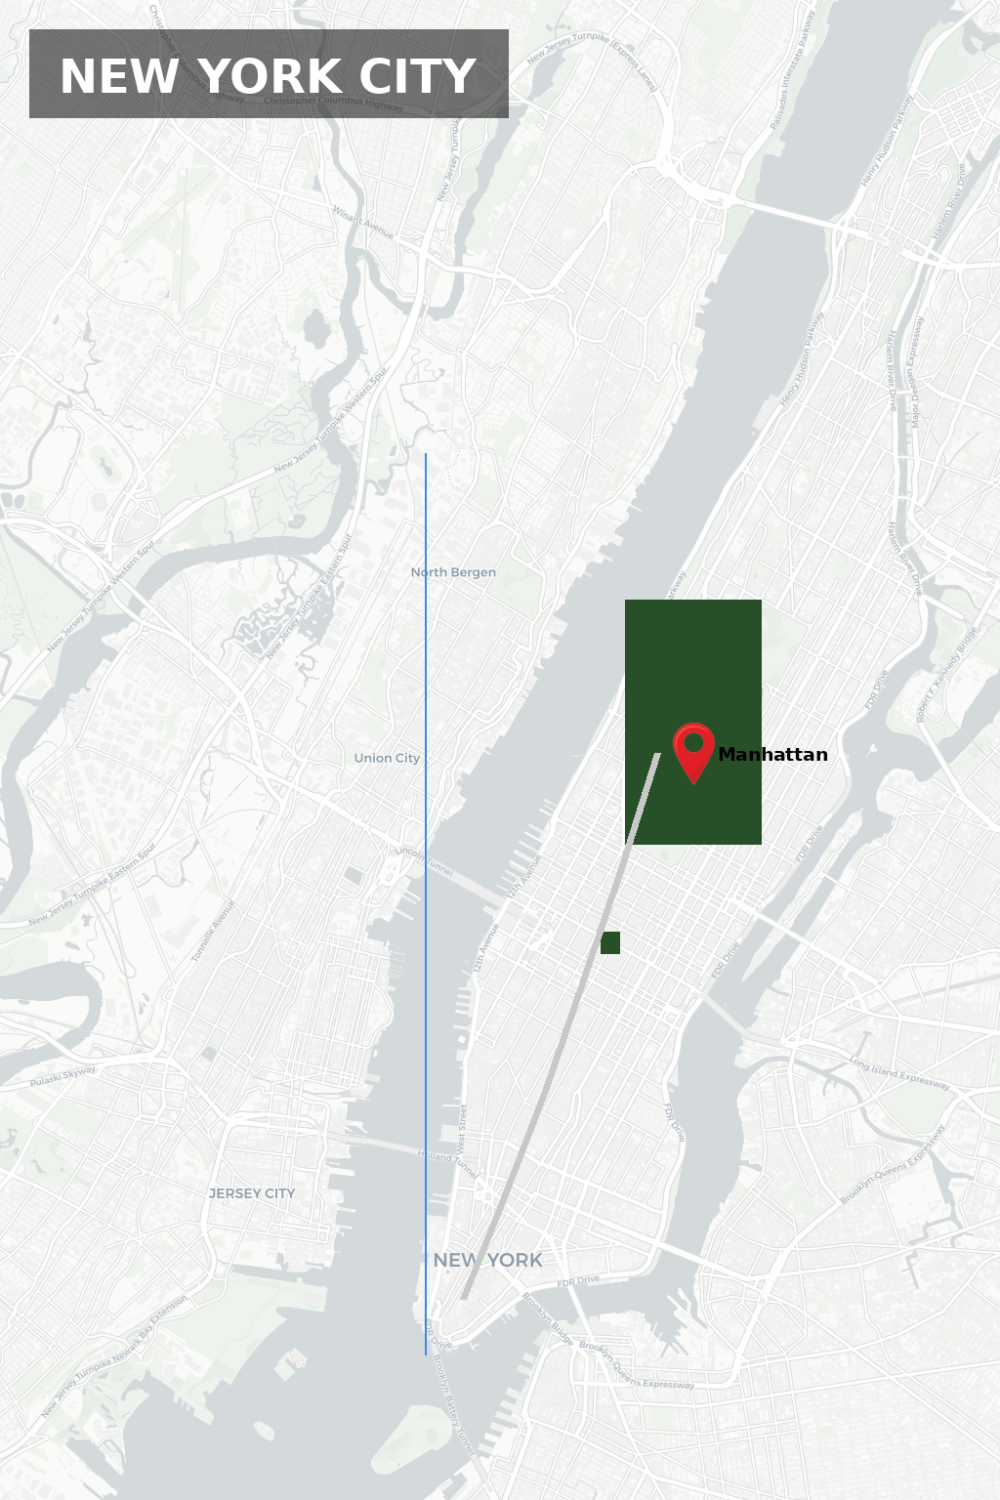
Every image in this article was generated from:
- OpenStreetMap GeoJSON
- Ruby
- libgd-gis
- ruby-libgd
No tiles. No screenshots. No JavaScript.
New York, Paris, Tokyo, and Paraná are computed as real raster maps.
Why this matters
Ruby now has a true raster GIS engine.
That enables:
- Scientific and journalistic cartography
- Automated map generation
- High-resolution exports
- GIS in CI pipelines
- Data-driven visualization
All from pure Ruby.
What’s next
Development is now moving toward:
- More advanced text placement
- Icon systems
- Additional OSM classifiers
- Light and dark themes
- Expanding documentation
libgd-gis is no longer an experiment — it is becoming a full cartographic stack for Ruby.
