January 30, 2026
When working with maps in Ruby or Ruby on Rails applications, most solutions assume that all geospatial data must be prepared upfront — usually as GeoJSON layers. While this works well for static datasets, it becomes inefficient when dealing with event-driven data such as sales, visits, calls, or real-time activity.
In many Rails applications, new coordinates arrive one by one through an API. Rebuilding or reprocessing a full GeoJSON layer for each update is unnecessary overhead.
To address this, I added a new API to libgd-gis: add_point.
Why add_point?
The goal of add_point is simple:
Render individual, customizable points on a map — incrementally — without rebuilding complex layers.
Instead of thinking in terms of datasets, add_point allows you to think in terms of events.
Each point can be rendered independently and styled at render time.
What can a point represent?
With add_point, each point can be rendered as:
- an image icon (PNG, JPG, etc.)
- a numeric marker: 1, 2, 3, …
- an alphabetic marker: a, b, c, …
- a symbol marker: *, +, -, /, (
This makes it suitable for many real-world use cases:
- sales appearing on a global dashboard
- incoming API requests
- phone calls or tickets
- live visits per city
- monitoring or observability maps
All rendered directly from Ruby, without external rendering engines.
Styling points with YAML
Point styling integrates with the existing style system.
Example (styles/solarized.yml):
global: label: color: [35, 35, 35, 20]point: font_color: [255, 85, 0] color: [0, 43, 54, 100] font: /usr/share/fonts/truetype/lato/Lato-Regular.ttf size: 12 icon: numeric
This allows consistent styling across the map while still letting each point override options when needed.
A practical example
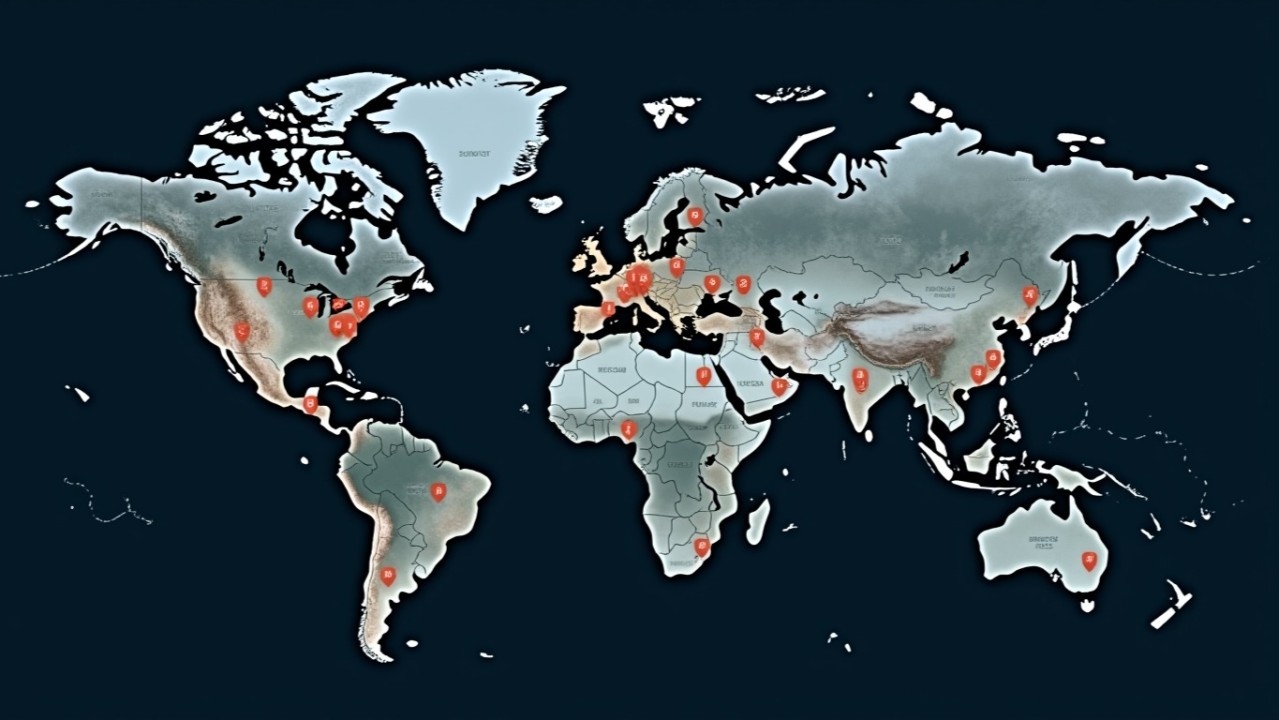
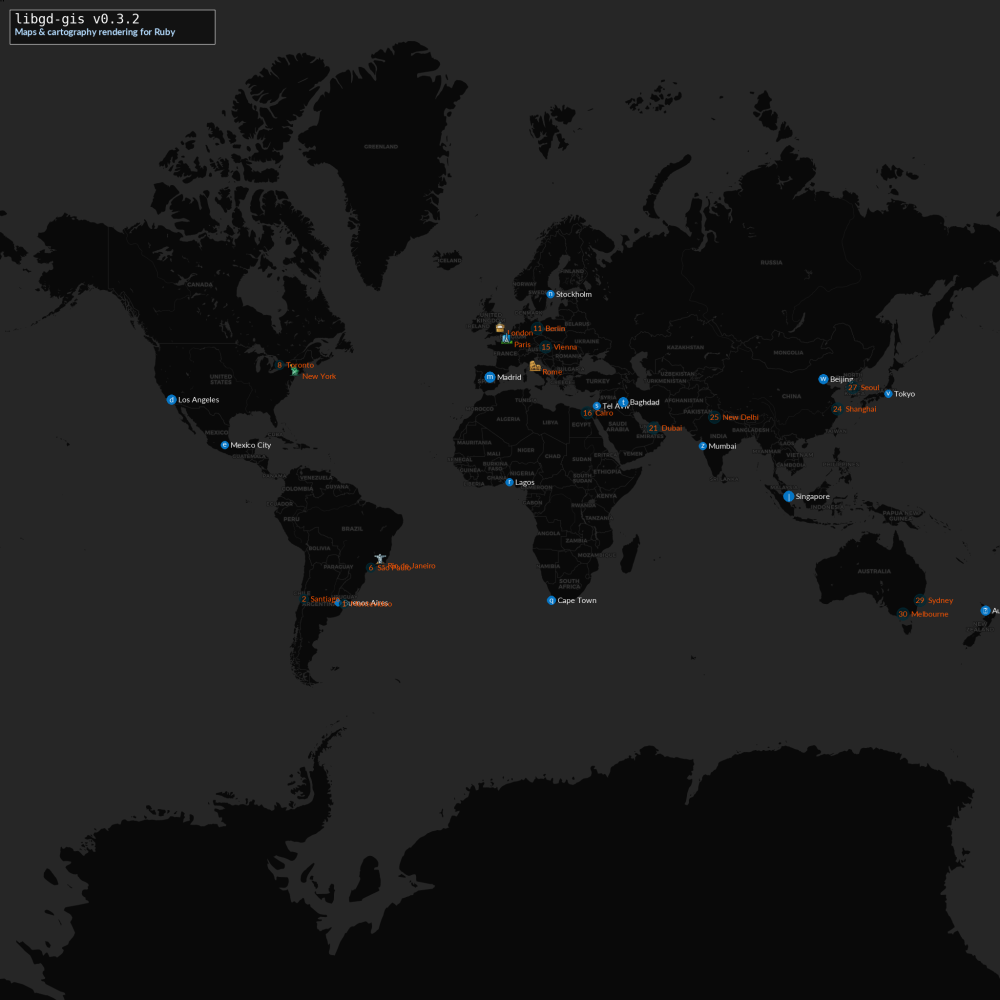
Below is a fully working example that renders a world map and incrementally adds points with different marker types.
This example mixes:
- icon-based landmarks
- numeric markers
- alphabetic markers
Setup
require "gd/gis"require "date"require_relative "fonts" # helper that picks a random system font
Drawing a simple legend
def draw_legend(img) padding = 10 x = 20 y = 20 w = 420 h = 70 bg = GD::Color.rgba(0,0,0,180) border = GD::Color.rgb(255,255,255) text1 = GD::Color.rgb(255,255,255) text2 = GD::Color.rgb(180,220,255) img.filled_rectangle(x, y, x+w, y+h, bg) img.rectangle(x, y, x+w, y+h, border) img.text( "libgd-gis v0.3.2", x: x + padding, y: y + 28, size: 20, color: text1, font: GD::Fonts.random ) img.text( "Maps & cartography rendering for Ruby", x: x + padding, y: y + 52, size: 14, color: text2, font: GD::Fonts.random )end
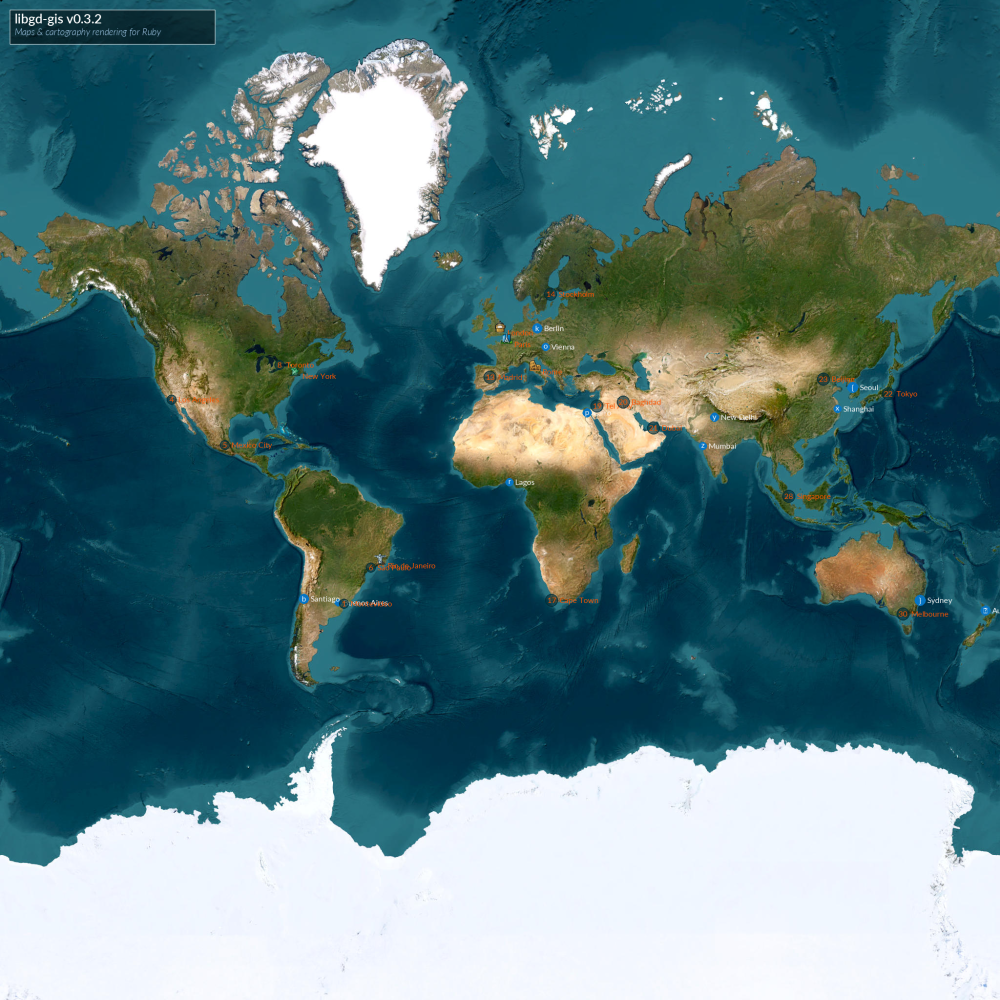
Creating the map
WORLD_BBOX = [-179.999, -85.0511, 179.999, 85.0511]OUTPUT = "output/point.png"map = GD::GIS::Map.new( bbox: WORLD_BBOX, zoom: 3, basemap: :carto_dark)map.style = GD::GIS::Style.load("solarized")
Incrementally adding points
cities = [ { lon: -58.3816, lat: -34.6037, name: "Buenos Aires" }, { lon: -56.1645, lat: -34.9011, name: "Montevideo" }, { lon: -70.6693, lat: -33.4489, name: "Santiago" }, { lon: -74.0060, lat: 40.7128, name: "New York", icon: "icons/statue_of_liberty_new_york.png" }, { lon: -43.1729, lat: -22.9068, name: "Rio de Janeiro", icon: "icons/christ_redeemer_rio.png" }, { lon: -0.1276, lat: 51.5074, name: "London", icon: "icons/big_ben_london.png" }, { lon: 2.3522, lat: 48.8566, name: "Paris", icon: "icons/eiffel_tower_paris.png" }, { lon: 12.4964, lat: 41.9028, name: "Rome", icon: "icons/colosseum_rome.png" }]
cities.each_with_index do |p, index| if p[:icon] map.add_point( lon: p[:lon], lat: p[:lat], label: p[:name], icon: p[:icon] ) else if [true, false].sample map.add_point( lon: p[:lon], lat: p[:lat], label: p[:name], symbol: index ) else map.add_point( lon: p[:lon], lat: p[:lat], label: p[:name], icon: "alphabetic", color: [6, 117, 196], font_color: [250, 250, 250], symbol: index ) end endend
Rendering
map.renderimg = map.imagedraw_legend(img)img.save(OUTPUT)puts "✔ Generated: #{OUTPUT}"
Why this fits Rails well
This approach maps naturally to Rails applications:
- each API request can call add_point
- no GeoJSON regeneration
- no tile servers
- no JavaScript rendering
- deterministic server-side output
It is especially useful for dashboards, reports, monitoring tools, or scheduled image generation.
Final thoughts
add_point is not about replacing GeoJSON. It is about complementing it with a simpler, event-oriented rendering model.
Sometimes, a map is just a list of points — and Ruby should be able to render that efficiently.